Table of Contents
Table of Contents
Executive Summary
The Cardus Education Survey provides nationally representative snapshots of the life trajectories of secondary-school graduates from government schools, Catholic independent schools, Protestant independent schools, and non-religious independent schools in the US, Canada, and Australia.
This report is the first to compare Cardus Education Survey results across the three countries, and it does so in the four areas of (1) preparation for adulthood, (2) civic engagement, (3) family formation, and (4) religiosity.
Life Preparation. American graduates feel, overall, the most prepared for life after school in terms of college success and interaction with society. However, American Protestant-school graduates are the least likely of any sector in any country to feel prepared for interacting with society. This finding underscores a key opportunity for improvement. Canadians believe their schools most prepared them for personal relationships (interestingly, with virtually no difference between school sectors in Canada on this measure).
Civic Engagement. Canadian Protestant-school graduates stand out as the most likely to have donated to charity and, by far, the most likely to have volunteered within the last year. Overall, Australian respondents are the most likely to give to charity, while Canadians are most likely to volunteer.
Family Formation. American respondents are the most likely to be married and the least likely to be divorced or separated. In each of these cases, these distinctions are especially true of Protestant-school graduates.
Religiosity. It is not surprising that American graduates are the most likely to pray, as Americans, in general, are more than twice as likely as Canadians and three times as likely as Australians to pray every day. What is, perhaps, surprising is that Canadian graduates are as likely or slightly more likely than Americans to engage with religious texts.
There is much to learn by identifying both what each country shares in common and the ways they differ. Our hope is that this report and its findings will spark hospitable conversations to improve all school sectors in the US, Canada, and Australia, as we seek to educate the next generation for the common good.
Introduction
What are Schools for?
What are schools for? This is a perennial question. For the past few decades in the modern West, education policy has been driven by a focus on economic outcomes—raising national GDP and ensuring that children have the requisite human capital for becoming productive employees and increasing their wages. Attention to now-everyday metrics such as test scores and educational attainment are typically justified based on their instrumental value for raising the likelihood of economic success.
Schools have generally followed suit, devoting considerable effort to academic instruction and closing achievement gaps. But that is not all they do. Attention to student psychic well-being, mental, emotional, and physical health has increased in recent years. Today, the challenge of a hyperpolarized public square has garnered renewed calls for improving civic education and social skills. While assessments of academic achievement have been part of educational institutions for decades, efforts to develop and integrate measures of psychic well-being or civic skills into the practice of teaching and learning are, at best, incipient.
The broadening of educational outcomes is a welcome development. Healthy communities have more than material wealth. Flourishing individuals have more than material comfort. They additionally have a sense of life purpose and personal connection to families, friends, and neighbours. For the past decade, the Cardus Education Survey has sought to underscore the manifold dimensions of human flourishing and the ways that schools—government, religious independent, and non-religious independent institutions—contribute to that end. In this report and for the first time in the history of the Cardus Education Survey, we aggregate that data to provide comparative country-level snapshots of graduates from American, Canadian, and Australian secondary schools.
The Cardus Education Survey
Since 2011, Cardus has regularly surveyed secondary-school graduates of government, Catholic, Protestant, and secular independent schools across the US, Canada, and most recently Australia—forming the largest representative, reliable non-government dataset of graduate outcomes in those countries. The Cardus Education Survey has been administered to nationally representative samples of twenty-four- to thirty-nine-year olds in each country to measure them on a variety of educational and life outcomes—for a combined sample size of 18,001 respondents.
American graduates have been surveyed three times in 2011, 2014, and 2018, 1 1 R. Pennings, J. Seel, D. Van Pelt, D. Sikkink, and K. Wiens, “Cardus Education Survey: Do the Motivations for Private Religious Catholic and Protestant Schooling in North America Align with Graduate Outcomes?,” Cardus, 2011, https://www.cardus.ca/research/education/reports/cardus-education-survey-phase-i-report-2011/; R. Pennings, D. Sikkink, A. Berner, C. Smith, M. Berends, J. Dallavis, and S. Skiles, “Cardus Education Survey 2014: Private Schools for the Public Good,” Cardus, 2014, https://www.cardus.ca/research/education/reports/cardus-education-survey-2014-private-schools-for-the-public-good/; M. Casagrande, R. Pennings, and D. Sikkink, “Cardus Education Survey 2018: Rethinking Public Education,” Cardus, 2019, https://www.cardus.ca/research/education/reports/rethinking-public-education/. as have Canadians in 2012, 2016, and 2018. 2 2 R. Pennings, D. Sikkink, D. Van Pelt, H. Van Brummelen, and A. von Heyking. “Cardus Education Survey: A Rising Tide Lifts All Boats,” Cardus, 2012, https://www.cardus.ca/research/education/reports/cardus-education-survey-phase-ii-report-2012/; B. Green, D. Sikkema, D. Sikkink, S. Skiles, and R. Pennings, “Cardus Education Survey 2016: Educating to Love Your Neighbour,” Cardus, 2016, https://www.cardus.ca/research/education/reports/cardus-education-survey-2016-educating-to-love-your-neighbour/; B. Green, D. Sikkema, and D. Sikkink, “Cardus Education Survey 2018: British Columbia Bulletin,” Cardus, 2018, https://www.cardus.ca/research/education/reports/cardus-education-survey-2018-british-columbia-bulletin/; B. Green, D. Sikkema, and D. Sikkink, “Cardus Education Survey 2018: Ontario Bulletin,” Cardus, 2018, https://www.cardus.ca/research/education/reports/cardus-education-survey-2018-ontario-bulletin/. Australians were surveyed between October and December 2019, a few short months before the COVID-19 lockdowns of 2020 3 3 A. Cheng and D. Iselin, “Cardus Education Survey Australia: Australian Schools and the Common Good,” Cardus and Cardus Education Survey Australia Consortium, August 2020, https://carduseducationsurvey.com.au/wp-content/uploads/2020/08/Cardus-Education-Survey-Australia_Full-Report-Final.pdf. The findings from this research have been documented and summarized in a now-extensive collection of reports available at the Cardus website CardusEducationSurvey.com.
These data over the past decade have provided a picture of the life trajectories of graduates across the various school sectors. For example, the Cardus Education Survey describes the ways that graduates are civically engaged through volunteering, charitable giving, and membership in religious, political, professional, and other social groups. It further considers aspects of family formation, including marriage and divorce rates, as well as their engagement with religion, spiritual practices, and finding a sense of purpose or direction in life. The Cardus Education Survey also queries respondents about their work life—earnings, place of employment, views about work—and asks them to reflect on their secondary-schooling experiences. Taken together, these data points make known the ways that graduates from various sectors of each country’s education landscape contribute to the life and common good of their communities. In this sense, all schools serve the public because they contribute to a good that is public.
How to Read this Report
The Cardus Education Survey has catalyzed widespread policy and research discussions about the formative role and effects of the different school sectors that make up a country’s education system. These important discussions, however, have not been limited to policy-makers but have extended to educators, school leaders, and parents. Concerted efforts to improve the practice of teaching and learning, to ensure that all children receive the education they need, and to discern how to steward educational institutions with greater fidelity have arisen from individuals who came together to consider and reflect on the Cardus Education Survey data. Regardless of school sector, all have identified achievements to celebrate and areas in need of improvement.
This report was written with the same spirit—to encourage thoughtful reflection about the educative work done by families, other members of school communities, and the broader communities in which they are situated. While prior Cardus Education Survey reports have focused on different school sectors within a particular country, this report provides the same data but aggregates them so that readers can make comparisons across different countries.
We provide a variety of cross-country comparisons of the outcomes that the Cardus Education Survey measures, using the most recent data collected for each country. We first report country-level averages of these outcomes for respondents from the US, Canada, and Australia. This approach mimics the work of international testing initiatives, such as the Programme for International Student Assessment. Data for the US and Canada come from the 2018 administration of the Cardus Education Survey. Data for Australia come from the 2019 administration. The sample sizes for the American and Canadian data are 2,716 and 3,855, respectively. A total of 4,913 respondents participated in the Australian administration of the CES. We then provide results by the four sectors across each country. In other words, we compare public government schools in the US, Canada, and Australia with each other. We then do the same for Catholic independent schools, Protestant independent schools, and other independent schools.
We hope that the resulting discussions will be fruitful as readers engage with one another about the data, identifying areas within their own school communities to celebrate as well as areas in need of improvement. We also caution against insisting on a specific explanation behind the results. Although raising points that potentially explain differences across countries is valuable for spurring further discussion, we encourage readers to recognize the difficulty in isolating causes behind any observed differences. Countries differ from one another for a variety of reasons and having some skepticism and intellectual humility about which of these precise reasons might underlie any observed differences would be prudent. It is our desire that the data points in this report will play at least a modest role in supporting the shared effort toward school improvement and enabling communities to better serve the educational needs of their children.
Background of the Education Systems in the United States, Canada, and Australia
In this section, we provide some background on the education systems in the US, Canada, and Australia. Volumes have been dedicated to describing the policies, organization, and histories of these systems at each country’s national, regional, and local levels. We cannot cover all of this content in depth within this report, but we offer some brief descriptions to orient readers unfamiliar with any or all three of the education systems in these three countries. We will describe the various schooling sectors for each country, making remarks about their character, size, and histories. These rudimentary facts about the school sectors within each country are intended to help readers contextualize the results that we present in later sections of this report. We encourage readers interested in learning more about these systems to avail themselves of the abundance of resources that have been written on these topics.
United States
In the fall of 2017, 57 million children were enrolled in primary and secondary schools in the US. An overwhelming majority of these students, approximately 51 million, attended public schools. The remaining 6 million students, which represent about 10 percent of enrolment, attended independent schools. 4 4 C. De Brey, T.D. Snyder, A. Zhang, and S.A. Dillow, “Digest of Education Statistics 2019,” National Center for Education Statistics, Institute of Education Sciences, U.S. Department of Education, 2021, NCES 2021-009.
Public Schools
Three main types of schools make up the US public school sector. The most common type is the traditional public school, the institution whose roots can be traced to the country’s mid-nineteenth-century common school movement. The other two types of public schools are charter schools and magnet schools. These are more recent institutions, established toward the latter half of the twentieth century. Although we use the term “public school” to describe this sector of US schools, we will use the term “government school”—for the sake of consistency between the three countries—later in the report when we present findings.
Independent Schools
Among children enrolled in public schools, a majority of them attend traditional public schools. Of the 51 million public-school students in 2017, about 45 million attended a traditional public school. 5 5 De Brey, Snyder, Zhang, and Dillow, “Digest of Education Statistics 2019,” 43. With few exceptions, students must enrol in the traditional public school that is assigned to them based on their place of residence. Recently, some districts have explored programs that offer residents more options, allowing them to transfer to a traditional public school outside their assigned school’s catchment zone.
Traditional public schools are governed and operated by local school districts. Currently, there are nearly 14,000 school districts across the nation. 6 6 De Brey, Snyder, Zhang, and Dillow, “Digest of Education Statistics 2019,” 128. School districts are governed by local school boards, but they are not the only entity overseeing traditional public schools. Each of the fifty state governments and the District of Columbia also play a role in governing the traditional public schools within their respective borders. Alongside state and local governments, the federal government also plays a significant, though smaller role. In the 2016–2017 school year, the federal government provided about 8 percent of all school funding, while state and local governments provided approximately an even share of the remainder. Per pupil expenditures in the 2019–2020 school year were just under $14,000 USD. 7 7 De Brey, Snyder, Zhang, and Dillow, “Digest of Education Statistics 2019,” 195.
Charter Schools
Charter schools are the second-most-popular type of public school, though only 2.5 million students, or 5 percent of all public-school students, attended them in 2016. Although relative enrolment is small, charters have grown rapidly since their inception. The first charter school opened thirty years ago in the state of Minnesota in 1992. Since then, forty-three of the fifty states as well as the District of Columbia have charter schools. There were about 7,000 charter schools in the nation during the 2016–2017 school year. 8 8 De Brey, Snyder, Zhang, and Dillow, “Digest of Education Statistics 2019,” 134.
Charter schools differ from traditional public schools because students may attend them regardless of their place of residence. Like traditional public schools, charter schools are tuition-free, as they receive public funds. Nonetheless, while traditional public schools receive funding from the local, state, and federal governments, charter schools do not receive local funds, resulting in a funding gap that has been well documented. 9 9 C.A. DeAngelis, P.J. Wolf, L.D. Maloney, J.F. May, “Charter School Funding: Inequity Surges in the Cities,” School Choice Demonstration Project, University of Arkansas, 2020, https://files.eric.ed.gov/fulltext/ED612068.pdf.
Unlike traditional public schools, charter schools are not primarily governed and managed by a local school district. Instead, charter schools are overseen by an authorizing body, entities that vary across US states but include post-secondary institutions, independent charter boards, non-profit organizations, or local and state governments. The authorizing body, however, does not directly operate the school.
Nor are charter schools subject to all the regulations that traditional public schools face. They are, however, expected to use that greater autonomy to meet specified educational goals. These goals are outlined in formal charters that are approved by authorizers, who have the power to either renew the charter or close down the school. Some charters are established to serve students from disadvantaged backgrounds, and others might be organized around a particular pedagogical approach or specialized curriculum such as an emphasis in the arts or the sciences.
Because of these distinctions from traditional public schools, “government school” may not be the most precise label to use to categorize charter schools. Yet for the purposes of this report, we include charter schools in the government-school sector given their proximate connection to traditional public schools in the imagination of people in the US.
Magnet Schools
The third major type of public school in the US is the magnet school. The first magnet school opened in 1968; in the 2016–2017 school year, about 3,000 magnet schools served 2.5 million students, or about 5 percent of all public-school students. 10 10 De Brey, Snyder, Zhang, and Dillow, “Digest of Education Statistics 2019,” 134. Magnet schools are governed and managed by local school districts, but unlike traditional public schools, they are open to all students regardless of where they live. Local public funds support magnet schools, and students are not charged tuition. Like some charter schools, magnet schools typically provide a specialized theme-based education.
Magnet schools were established beginning in the late 1960s during a period of racial desegregation in the US. The policy of residential assignment to traditional public schools together with the reality of racially segregated neighbourhoods made traditional public schools racially segregated. By opening enrolment to all students and offering a specialized theme-based education, magnet schools were proposed as a way to draw families across typical residential boundaries and to form more racially integrated schools. Today, magnet schools offer a different schooling option for families much like charter schools.
Independent Schools
Alongside public schools, the US has a long-standing but smaller sector of independent—or, more commonly, “private”—schools. Only about 10 percent of all school-aged children attend independent schools. 11 11 De Brey, Snyder, Zhang, and Dillow, “Digest of Education Statistics 2019,” 43. The sector primarily comprises Catholic, Protestant, and non-sectarian schools. There is additionally a smaller subset of Jewish and Islamic schools.
Unlike independent schools in Canada and Australia, US independent schools generally do not receive public funding. They are primarily sustained by student tuition. The only exceptions are the sixty-seven separate private-school-choice programs found across twenty-nine states that support 600,000 students—barely 1 percent of all schoolchildren in the country 12 12 EdChoice, “The ABCs of School Choice: The Comprehensive Guide to Every Private School Choice Program in America,” March 2021, 7–8, https://www.edchoice.org/wp-content/uploads/2021/03/2021-ABCs-of-School-Choice-WEB-2-24.pdf. Some of these programs offer vouchers or scholarships to students. Others, called education savings accounts, provide families with public funds that they may spend on tuition, curriculum, tutoring, therapy, and other educational expenses for their children. Participation in US private-school-choice programs is typically limited to families below a specific income threshold or to families of children with special needs.
Catholic Schools
Catholic communities in the US began building Catholic independent schools in the mid-nineteenth century, largely in response to the common school movement. At the time, public schools reflected the dominant religion and were Protestant in character. Catholic communities, wanting to instruct their children in the Catholic faith, formed their own independent schools.
In the middle of the twentieth century, Catholic schools increasingly enrolled non-Catholic students. As Catholic families left urban centres, Catholic schools responded by choosing to remain and opening their doors to non-Catholic families, particularly those from lower socioeconomic backgrounds. Influenced by Catholic social teaching, Catholic schools aimed to provide educational opportunities to these families and set up their children for later-life success, while also offering them some religious instruction.
Enrollment at Catholic independent schools reached its peak in the 1960s, when they served more than 5 million students across 13,000 schools nationwide. By 2017, enrollment had fallen by over half. There were about 2 million Catholic independent school students, and Catholic independent schools continue to close due to declining enrolments. 13 13 De Brey, Snyder, Zhang, and Dillow, “Digest of Education Statistics 2019,” 94.
Protestant Schools
As Catholic independent schools were established in the mid-nineteenth century, German and Dutch immigrant communities in the Midwestern US founded Lutheran and Reformed independent schools, respectively. Other Protestant denominations also founded their own schools at the time, and many of these schools remain in operation today.
However, many other Protestant schools have a more recent origin. In the latter part of the twentieth century, many Protestant communities reacted to various events that indicated an increasing secularization of culture. Supreme Court decisions to ban school prayer or to prohibit the banning of teaching evolution as well as the emerging drug culture and sexual revolution motivated many concerned Protestant communities to start their own schools where they could educate their children according to their values.
In 2017, just under 2 million students were enrolled in an independent school with a Protestant Christian affiliation. 14 14 De Brey, Snyder, Zhang, and Dillow, “Digest of Education Statistics 2019,” 94.
Other Independent Schools
The US also boasts a non-sectarian and non-Christian religious sector of independent schools. Some of these schools were established around the time of the nation’s founding and have a reputation for being highly selective and elite. Other non-sectarian independent schools, such as Montessori and Waldorf schools, were founded in the early twentieth century as those educational movements began taking root in the US. Enrolling about 1.4 million students in 2017, the non-sectarian independent school sector is smaller than the religious-independent-school sector. 15 15 De Brey, Snyder, Zhang, and Dillow, “Digest of Education Statistics 2019,” 94. Alongside non-sectarian independent schools are a long-standing network of Jewish independent schools and, more recently, a growing network of Islamic independent schools.
Canada
Unlike the US and Australia, Canada has no federal education department. The ten provinces are each responsible for governing and managing their respective education systems. 16 16 The territories administer their own education, but officially it takes place under the essentially benevolent and distant supervision of the federal government. Unlike the provinces, territories have no inherent jurisdiction over education, as no constitutive legislation gives them that authority. Nevertheless, they have developed and operate their own education structures (D. Allison and D. Van Pelt, “Canada,” in Balancing Freedom, Autonomy and Accountability in Education, ed. C. Glenn and J. de Groof (Nijmegen: Wolf Legal Publishers, 2012), 3:79–142. This decentralized arrangement has been constitutionally guaranteed since Confederation in 1867. There are, as a result, several policy differences with respect to accountability, assessment, teacher training, and funding across the country. Each province’s education systems uniquely developed in response to local issues, interests, and opportunities that emerged at particular junctures in their province’s history, independent of a national agenda. There are, of course, similarities between provinces, but in comparison to the neighbouring United States, Canada’s constitutionally-protected decentralized education structure is a root distinction.
Enrolment
As of 2019–2020, there are over 5.7 million elementary and secondary-school students enrolled in Canada. Over 5 million, or 91.8 percent, are enrolled in government schools (including francophone and separate schools), 433,000 (7.6 percent) are enrolled in independent schools, and the remaining 37,000 (0.6 percent) homeschool. 17 17 Statistics Canada, “Table 37-10-0109-01: Number of Students in Elementary and Secondary Schools, by School Type and Program Type,” accessed June 21, 2022, https://www150.statcan.gc.ca/t1/tbl1/en/tv.action?pid=3710010901. The proportion of independent-school students differs widely across provinces: from as low as 1.3 percent of total enrolment in east coast New Brunswick to as high as 13.1 percent in west coast British Columbia.
Funding
Although the details vary by province, public schools in Canada are generally funded through centrally administered provincial grants via a combination of general provincial tax revenue and local property taxes. Public expenditures for public-school students range from a low of $12,513 CAD per student in British Columbia to a high of $15,486 CAD per student in New Brunswick, with a Canadian mean of $14,070 CAD per student. 18 18 P. MacPherson, J. Emes, and N. Li, “Education Spending in Public Schools in Canada,” Fraser Institute, Fall 2021, 7, https://www.fraserinstitute.org/studies/education-spending-in-public-schools-in-canada-fall-2021. Excluding capital costs, operating expenses are a median of $9,458 CAD per public-school student in Canada. 19 19 D. Hunt, A. Momoh, and D. Van Pelt, “Funding All Students: A Comparative Economic Analysis of the Fiscal Cost to Support Students in Ontario Independent Schools,” Cardus, September 2021, 27, https://www.cardus.ca/research/education/reports/the-cost-to-fund-students-in-ontario-independent-schools/. All provinces outside Ontario and Atlantic Canada offer the option of some taxpayer funding for independent schools. Regulations and funding schemes vary considerably. Depending on the funded province, the exact funding amount ranges from 35 percent to 80 percent of the public-school per-student operating grants, or about $3,300 CAD for British Columbia “Group 2” independent schools and about $7,600 CAD per student for Saskatchewan’s “Associate” independent schools, respectively. 20 20 Hunt, Momoh, and Van Pelt, “Funding All Students,” 44, 51. Generally speaking, most independent schools outside Ontario and Atlantic Canada receive 50 percent of the public-school rate for operating expenses. Over 250,000 independent-school students—that is, about 59 percent—receive at least partial funding in Canada. 21 21 Authors’ calculations from Hunt, Momoh, and Van Pelt, “Funding All Students,” 11–13.
Public Schools and Separate Schools
Canadian public schools have much in common with their American counterparts. The majority of students in all Canadian provinces attend their locally assigned public school. The school district catchment zones and the public schools within them are similar to those in the traditional public system in America or government schools in Australia. Moreover, although ultimately controlled at the provincial level, another similarity is that provinces delegate some authority to locally elected school boards. Although each province has its own unique history, Canadian public school systems, outside Quebec, generally find their roots in the common school movement of the mid-nineteenth century.
But there are significant structural and cultural differences—both between countries and from province to province. All Canadian provinces have both English and French school boards, and three provinces—Ontario, Alberta, and Saskatchewan—have constitutionally protected, fully funded Roman Catholic “separate” school boards, which essentially operate as parallel local school boards but with a Catholic emphasis.
Beyond that, Canada’s decentralized, provincially-controlled education structure does not make for readily available comparative data. For example, consider how different the education systems are in just the three provinces with separate schools. Alberta is the only province with charter schools. Saskatchewan, uniquely, has five distinct independent-school categories, which are all subject to different regulations and receive different levels of taxpayer funding. 22 22 Hunt, Momoh, and Van Pelt, “Funding All Students,” 41. And Ontario, unlike Alberta and Saskatchewan, does not financially support independent schools or their students. 23 23 Hunt, Momoh, and Van Pelt, “Funding All Students,” 34. Simply, no two provinces are the same; each has its own unique structure and mix of school systems.
Independent Schools
Similar to the US and Australia, Canada’s independent-school sector is diverse in composition. The largest subsector of independent schools in Canada is religious schools, making up roughly half the sector in terms of the number of schools and students. The majority of religious independent schools are non-Catholic Christian (such as non-denominational, Mennonite, Reformed, Baptist, Adventist, Pentecostal, and Anglican), and there is a growing number of Islamic, Jewish, Roman Catholic, and Sikh independent schools. Around 5 percent or less of Canada’s independent schools are top-tier, highly selective preparatory schools. The remaining near-half of independent schools are oriented around a special emphasis, pedagogy, or educational philosophy (such as Montessori, Waldorf, classical education, STEM, forest schools, sports, the arts, and a near-endless variety of approaches and emphases). 24 24 D. Allison, S. Hasan, and D. Van Pelt, “A Diverse Landscape: Independent Schools in Canada,” Fraser Institute, June 2016, https://www.fraserinstitute.org/sites/default/files/a-diverse-landscape-independent-schools-in-canada.pdf. Like religious independent schools, these “specialty” schools tend to be much smaller than public schools and operate in humble facilities, with minimal resources. 25 25 Forthcoming Cardus study by D. Hunt, J. DeJong VanHof, and J. Los. Some provinces, like British Columbia and Ontario, also have a robust subsector of Indigenous independent schools.
Australia
According to the Australian Bureau of Statistics, over 4 million students were enrolled in 9,542 primary and secondary schools across Australia in 2021. 26 26 Australian Bureau of Statistics, “Schools: Data on Students, Staff, Schools, Rates and Ratios for Government and Non-government Schools, for All Australian States and Territories,” February, 2021, https://www.abs.gov.au/statistics/people/education/schools/latest-release. Schools in Australia are divided into government schools and non-government schools. The former are governed, operated, and predominantly funded by the Australian state and territory governments, with the national government, also known as the Commonwealth Government, taking a limited role in regard to funding arrangements. Non-government schools are, in contrast, not operated by state and territory governments but do receive proportionate funding from them as well as funding from the Commonwealth Government. Both government and non-government schools are also responsible for teaching the national curriculum, which is overseen by the independent statutory body of the Australian Curriculum, Assessment and Reporting Authority (ACARA).
The bulk of government funding for non-government schools comes from the Commonwealth Government. According to the 2019 data from the ACARA, non-government schools receive about $9,100 AUD per pupil from the Commonwealth Government, with amounts varying based on student need. State and territory governments contribute about an additional $2,600 AUD per pupil. In contrast, government schools receive the majority of their funding from state and territory governments, almost $12,000 AUD per pupil, and an additional $3,000 AUD per pupil from the Commonwealth Government. 27 27 Australian Department of Education, Skills and Employment, “How Are Schools Funded in Australia?,” Australian Government, June 2021, https://www.dese.gov.au/quality-schools-package/fact-sheets/how-are-schools-funded-australia.
Funding for non-government schools does not necessarily cover the entire cost of student enrolment, as evidenced by the fees and tuition paid by families who enrol their children in those schools. On the other hand, government schools are free to attend, though many charge parents nominal fees for a variety of materials and services such as uniforms or extracurricular activities not covered by government funding.
Historically, non-government schools have been further subdivided into Catholic schools and independent schools. For the purposes of the analysis and discussion presented in this report, we identify another subgroup of non-government schools—namely, Christian schools. These schools are typically categorized as independent schools but have recently emerged as a major subgroup within the Australian education landscape. In the next sections, we provide additional background on this schooling sector as well as the Government, Catholic, and Independent schooling sectors.
Government Schools
A majority of Australia’s schoolchildren are enrolled in a government school. The movement to establish a system of free, compulsory, and non-sectarian government-operated schools occurred during the mid-nineteenth century, slightly after the Common School movement in the US. In 2018, about 2.6 million or nearly two-thirds of all primary- and secondary-school students attended one of the country’s 6,646 government schools. 28 28 Australian Bureau of Statistics, “Schools.” Though larger than the non-Government school sector, Australia’s Government-school sector is proportionately smaller than the public-school system in the US, which enrols about 90 percent of all American schoolchildren. Similar to the US traditional public-school system, families who choose to enrol their children in a government school typically must attend schools within the boundaries of established catchment areas.
Like traditional public and charter schools in the US, most Australian government schools are open to all students. Some Australian government schools, meanwhile, have selective admissions requirements or specialize in a specific theme such as fine arts, sports, or science, mathematics, engineering, and technology. These selective or specialized schools are akin to some American magnet schools. There are also some government schools that are dedicated to serving students with cognitive or physical disabilities.
Catholic Schools
Australia’s Catholic-school system began in the 1820s, providing a Catholic alternative to the network of Protestant schools that had arisen across the colony since British settlement in the late 1700s. Despite a growing Catholic population at the time, Australian society was primarily influenced by Protestantism. Catholic schools, in turn, were established to provide a Catholic educational alternative for Catholic communities. The initiative to build up the Catholic education system continued in the later nineteenth century, when the movement for compulsory schooling, the provision of free, secular education, and a temporary cessation of state aid for church-affiliated schools gained momentum. Unlike other church-affiliated schools at the time, the Catholic Church dedicated considerable effort and resources to build and maintain the Catholic-school system.
In 2018, about one-fifth of Australia’s schoolchildren, or about 770,000 students, attended one of the nation’s nearly 1,700 Catholic schools. 29 29 Australian Bureau of Statistics, “Schools.” This figure also represents over half of all non-government-school enrolments. A number of these schools are low-cost schools established in socially disadvantaged areas, while others are elite, higher-cost schools. Most Catholic schools are operated through a diocese or office within the Catholic Church. A few Catholic schools, however, though Catholic in character, operate independently.
Independent Schools
Together with Catholic schools, independent schools make up the Australian non-government-school sector. The Independent-school sector is diverse in composition. Given the historical Protestant influence in Australia, many of these schools are affiliated with particular denominations, including Anglican, Lutheran, United, Presbyterian, and Seventh-day Adventist. There are also a variety of Protestant schools that are not affiliated with a particular denomination. Islamic as well as Jewish independent schools have also been established in Australia. A small minority of independent schools have a Catholic affiliation; these schools are Catholic in character but operate independently from a diocese or formal office within the Catholic Church. Other independent schools, meanwhile, do not have any religious affiliation. Montessori and Steiner schools, for example, adopt a particular pedagogical approach. Other independent schools without a traditional faith affiliation serve specific populations such as students with disabilities or elite grammar-school students.
In 2018, just under 600,000 students attended independent schools. This represents about 15 percent of all Australian schoolchildren and slightly less than half of all non-government-school enrolments. 30 30 Australian Bureau of Statistics, “Schools.”
Christian Schools
Australia typically categorizes schools as government, Catholic, or independent. Within the last fifty years, however, a significant number of faith-based schools that are Protestant in character have emerged within the Independent-school sector. Unlike other independent schools that are also Protestant in character that are often systematically and denominationally governed, schools in the specifically titled “Christian school” sector were founded in the latter twentieth century and are generally governed through local parent associations or local churches. Enrolment in these Christian schools is often open and accessible to all prospective families within a given community. Although they are locally governed, they also identify with one of Australia’s major Christian school associations. Currently, there are over 145,000 students attending these types of Christian schools across Australia, 31 31 Cheng and Iselin, “Cardus Education Survey Australia,” 20. representing almost one-quarter of the Independent-school sector. For the purposes of this report, which makes international comparisons, we will refer to these schools as “Protestant schools,” as they are most similar to the Canadian and American Protestant-school sector. That said, we duly note that many Australian schools that would identify as Protestant have been categorized as independent schools within the Australian data for this report.
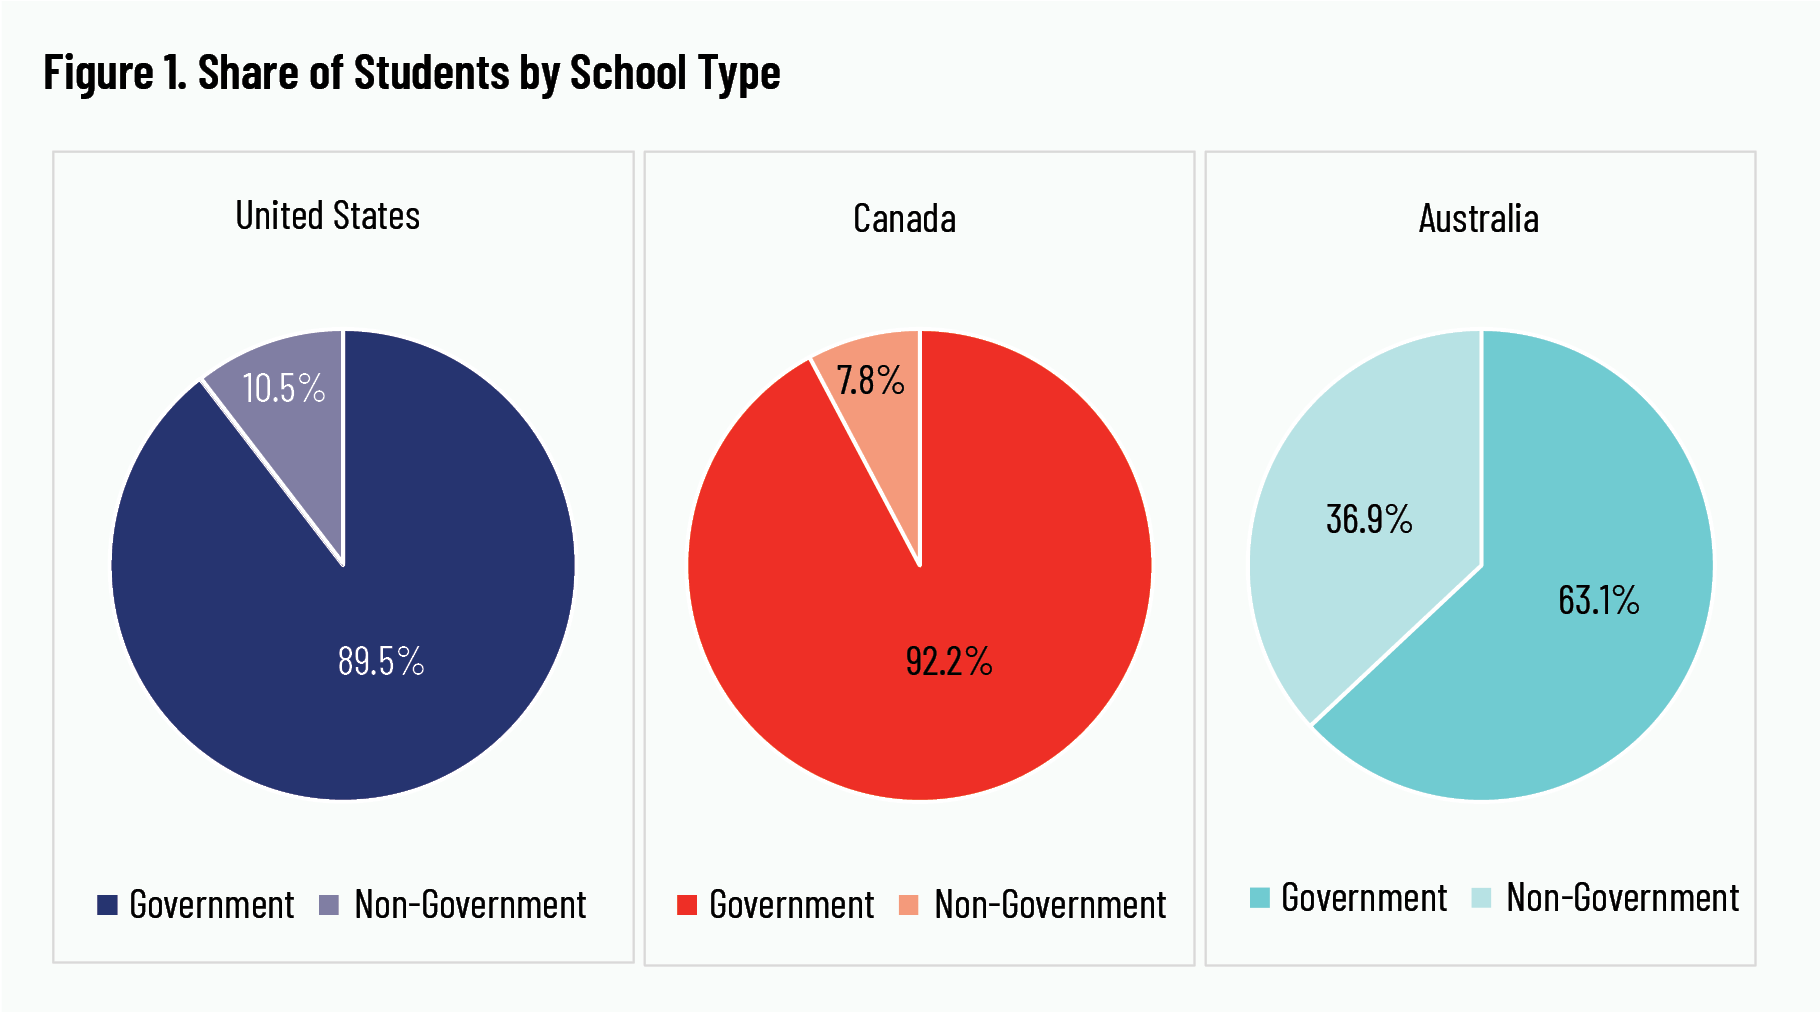
In summary, figure 1 compares the distribution of overall school enrolment (excluding homeschool) in the three countries.
Methodology and Limitations
For graduate outcome, we compare country-level averages to each other, first using the full sample of respondents from each country. Then we classify each respondent as a graduate from government, Catholic, Protestant, or independent schools based on the schooling sector in which the respondent spent a majority of their secondary-school years in one of the four specific school sectors. In other words, we begin by comparing all American, Canadian, and Australian respondents to each other. We then compare government-school graduates from the US, Canada, and Australia to one another. After that, the same comparisons are made for Catholic, Protestant, and independent school graduates from each respective country to one another.
Unlike previous Cardus reports, we opted not to control for demographic background characteristics. Attempting to rule out confounding factors that explain differences between respondents from different school sectors within the same country is difficult enough in correlational analyses such as ours. It is even more difficult to rule out other cross-country differences that may confound the differences we observe at the country level. The results below should be interpreted with this in mind.
Therefore, rather than trying to account for all of these potential confounding factors, we simply present country-level averages of the outcomes for respondents from each country as a whole and for respondents from specific school sectors within each country. Our goal is not to explain causes behind the observed differences across the countries but simply to describe those differences and spur discussion over the findings.
We highlight some of the findings regarding the four life domains in the next sections. We encourage readers to consider what these results mean for taking better care of our schools and serving students along with their families well.
We remind readers that in making comparisons across three countries, terminology for classifying school sectors becomes ambiguous. This limitation will be important to heed while viewing the results. For instance, US public schools are not conventionally called government schools, but for the purpose of presenting our results, we use the moniker “government school.” Unlike the US and Australia, Canada has two different types of Catholic schools, those that belong to the separate-school system and those that operate independently. These two types of Catholic schools are distinguished in prior Cardus reports that focus solely on Canadian data. However, for this multi-country report, we aggregate these two types of Catholic schools into a single Catholic-school sector to make comparisons with the US and Australia more feasible. The independent-school label likewise has nuances. Many independent schools in Australia have a historic tie to a Christian denomination. However, they are not affiliated with the growing network of more-recently-founded, locally governed Protestant schools. Although social science strives for the precision of terms, there is always some residual ambiguity. It will be important for readers to keep these caveats in mind as they carefully interpret the results.
Results
The separate reports about the 2018 administration of the Cardus Education Survey to American and Canadian respondents as well as the 2019 administration of the Cardus Education Survey to Australian respondents each contain a more extensive set of results than the set we present here. Respondents from each country were not asked to respond to the same questionnaire, so we consider only the subset of items that were asked to respondents from all three countries.
We consider four domains of respondents’ lives: (1) their reflections about how their secondary schools prepared them for adulthood, (2) civic engagement, (3) family formation, and (4) religiosity.
1. Preparation for Adulthood
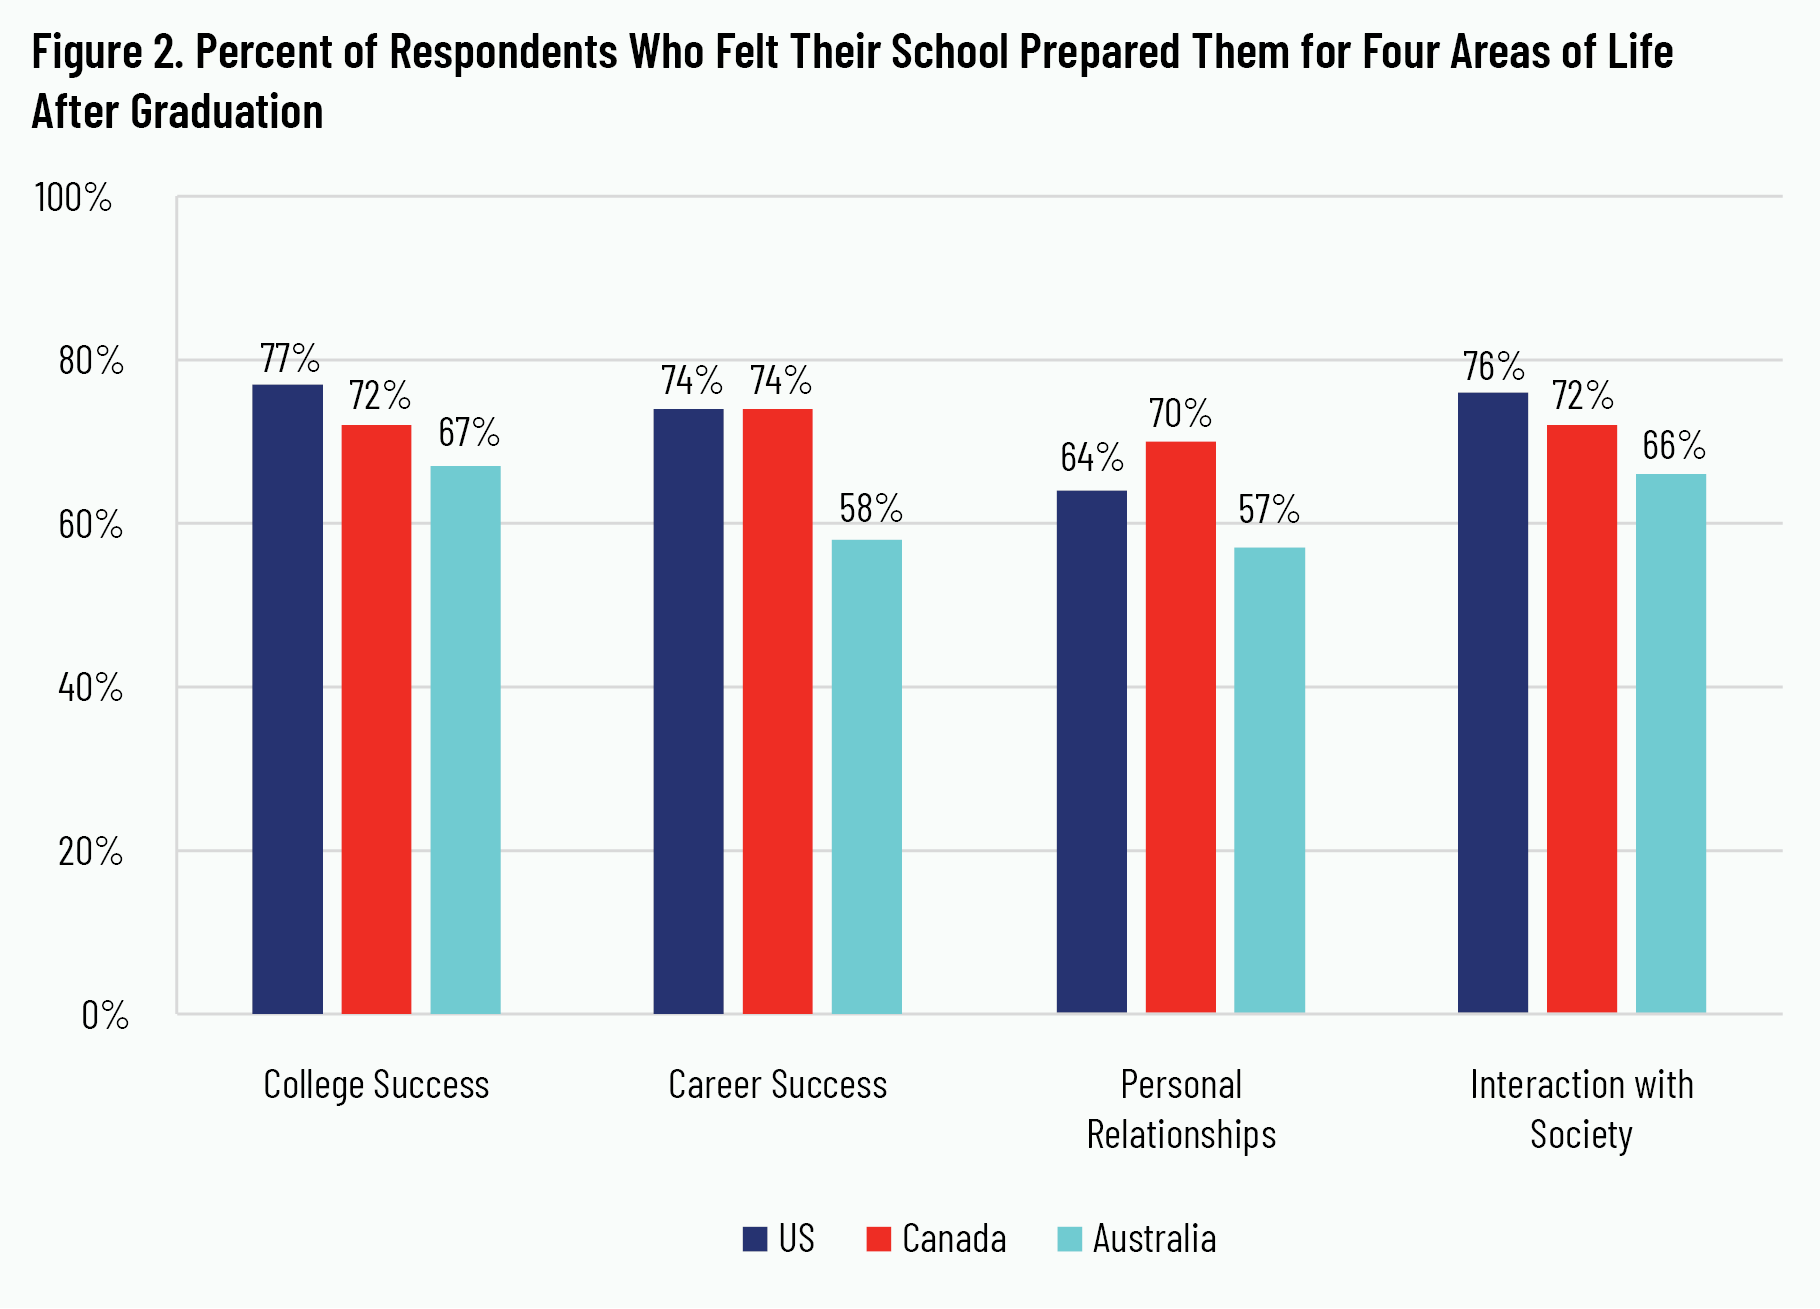
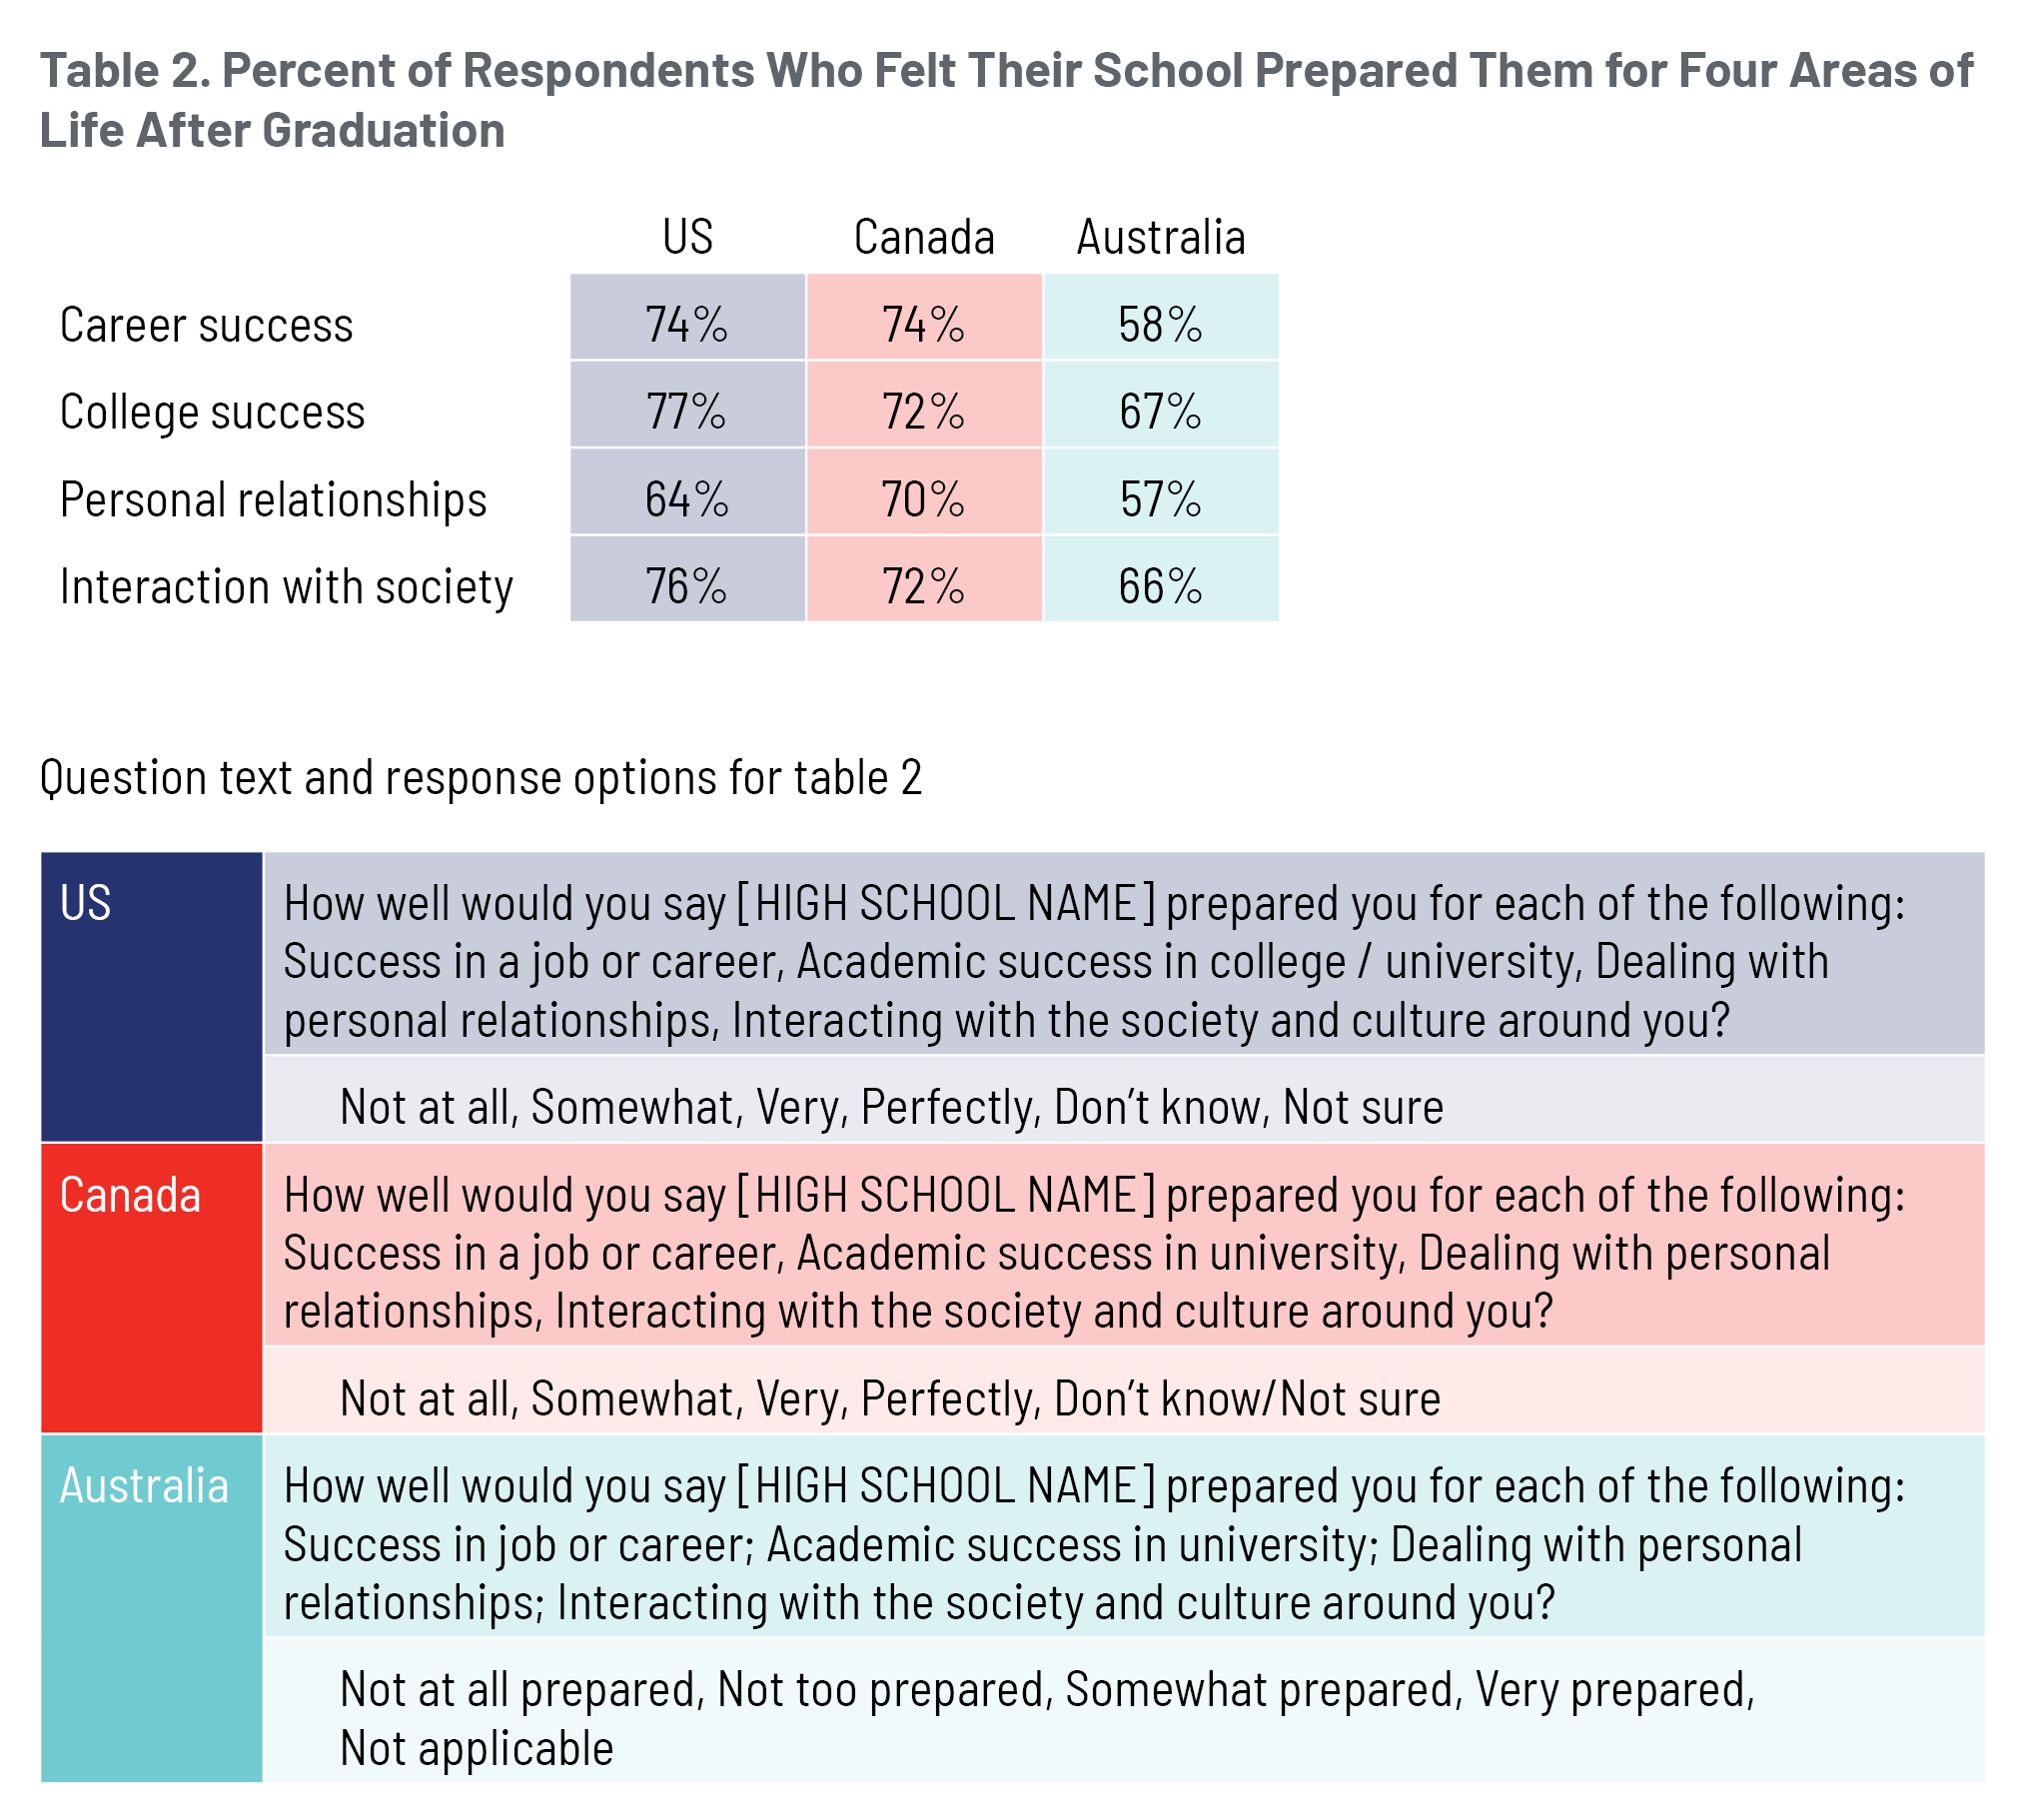
What do graduates from the US, Canada, and Australia think about the ways their school prepared them for adulthood? In the Cardus Education Survey, we asked respondents to describe how well their school prepared them for college success, career success, dealing with personal relationships, and how to interact with their surrounding society and culture.
In all four areas, Canadian and especially American respondents appeared to rate their schools more favourably than Australian respondents. The results are shown in figure 2. 32 32 For the exact wording of each question, please see the appendix. Around three-quarters of American and Canadian respondents thought their schools “somewhat,” “very,” or “perfectly” prepared them for (a) college, (b) career, and (c) interacting with their social and cultural milieu. US graduates were less likely to feel as prepared for dealing with personal relationships than for those three areas. Australian graduates reported feeling more prepared for college success and interacting with society than for career success and dealing with personal relationships.
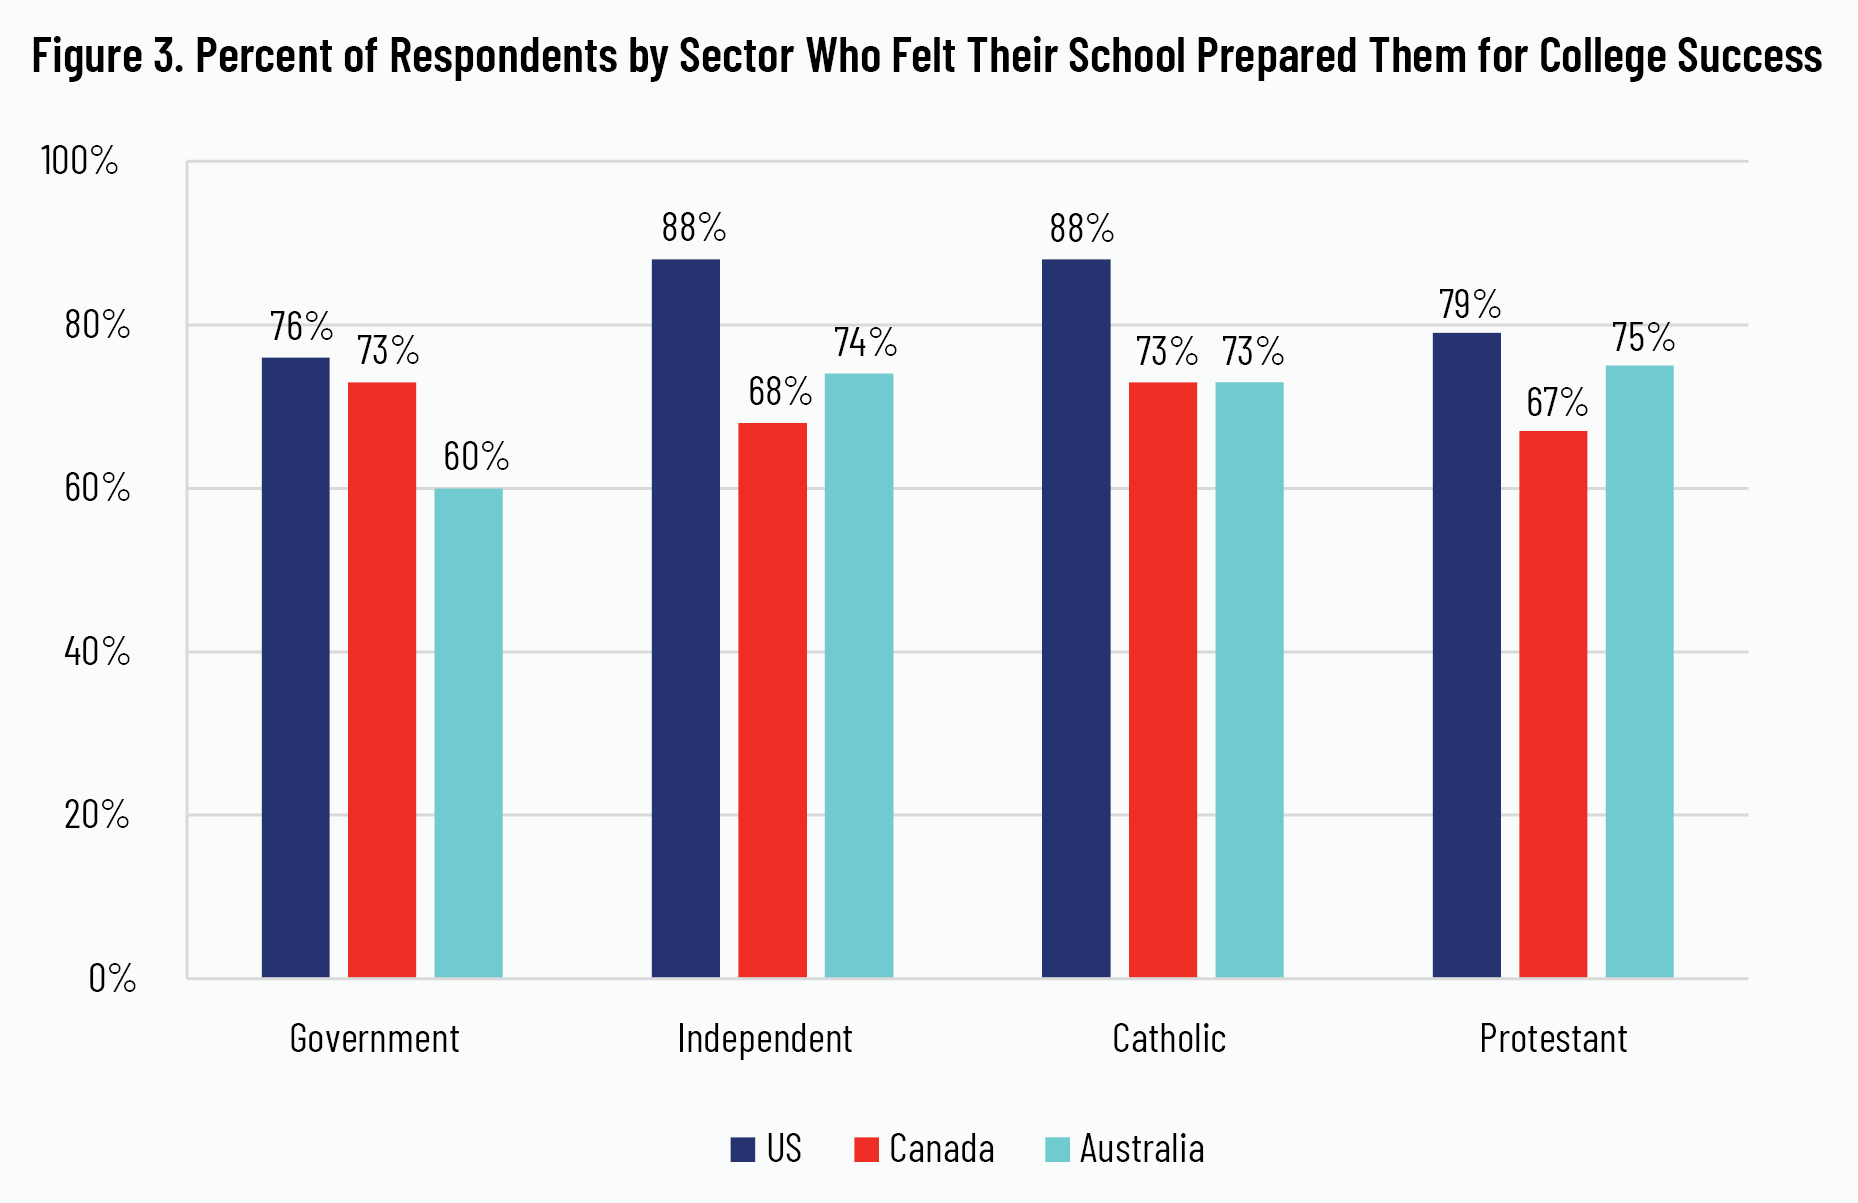
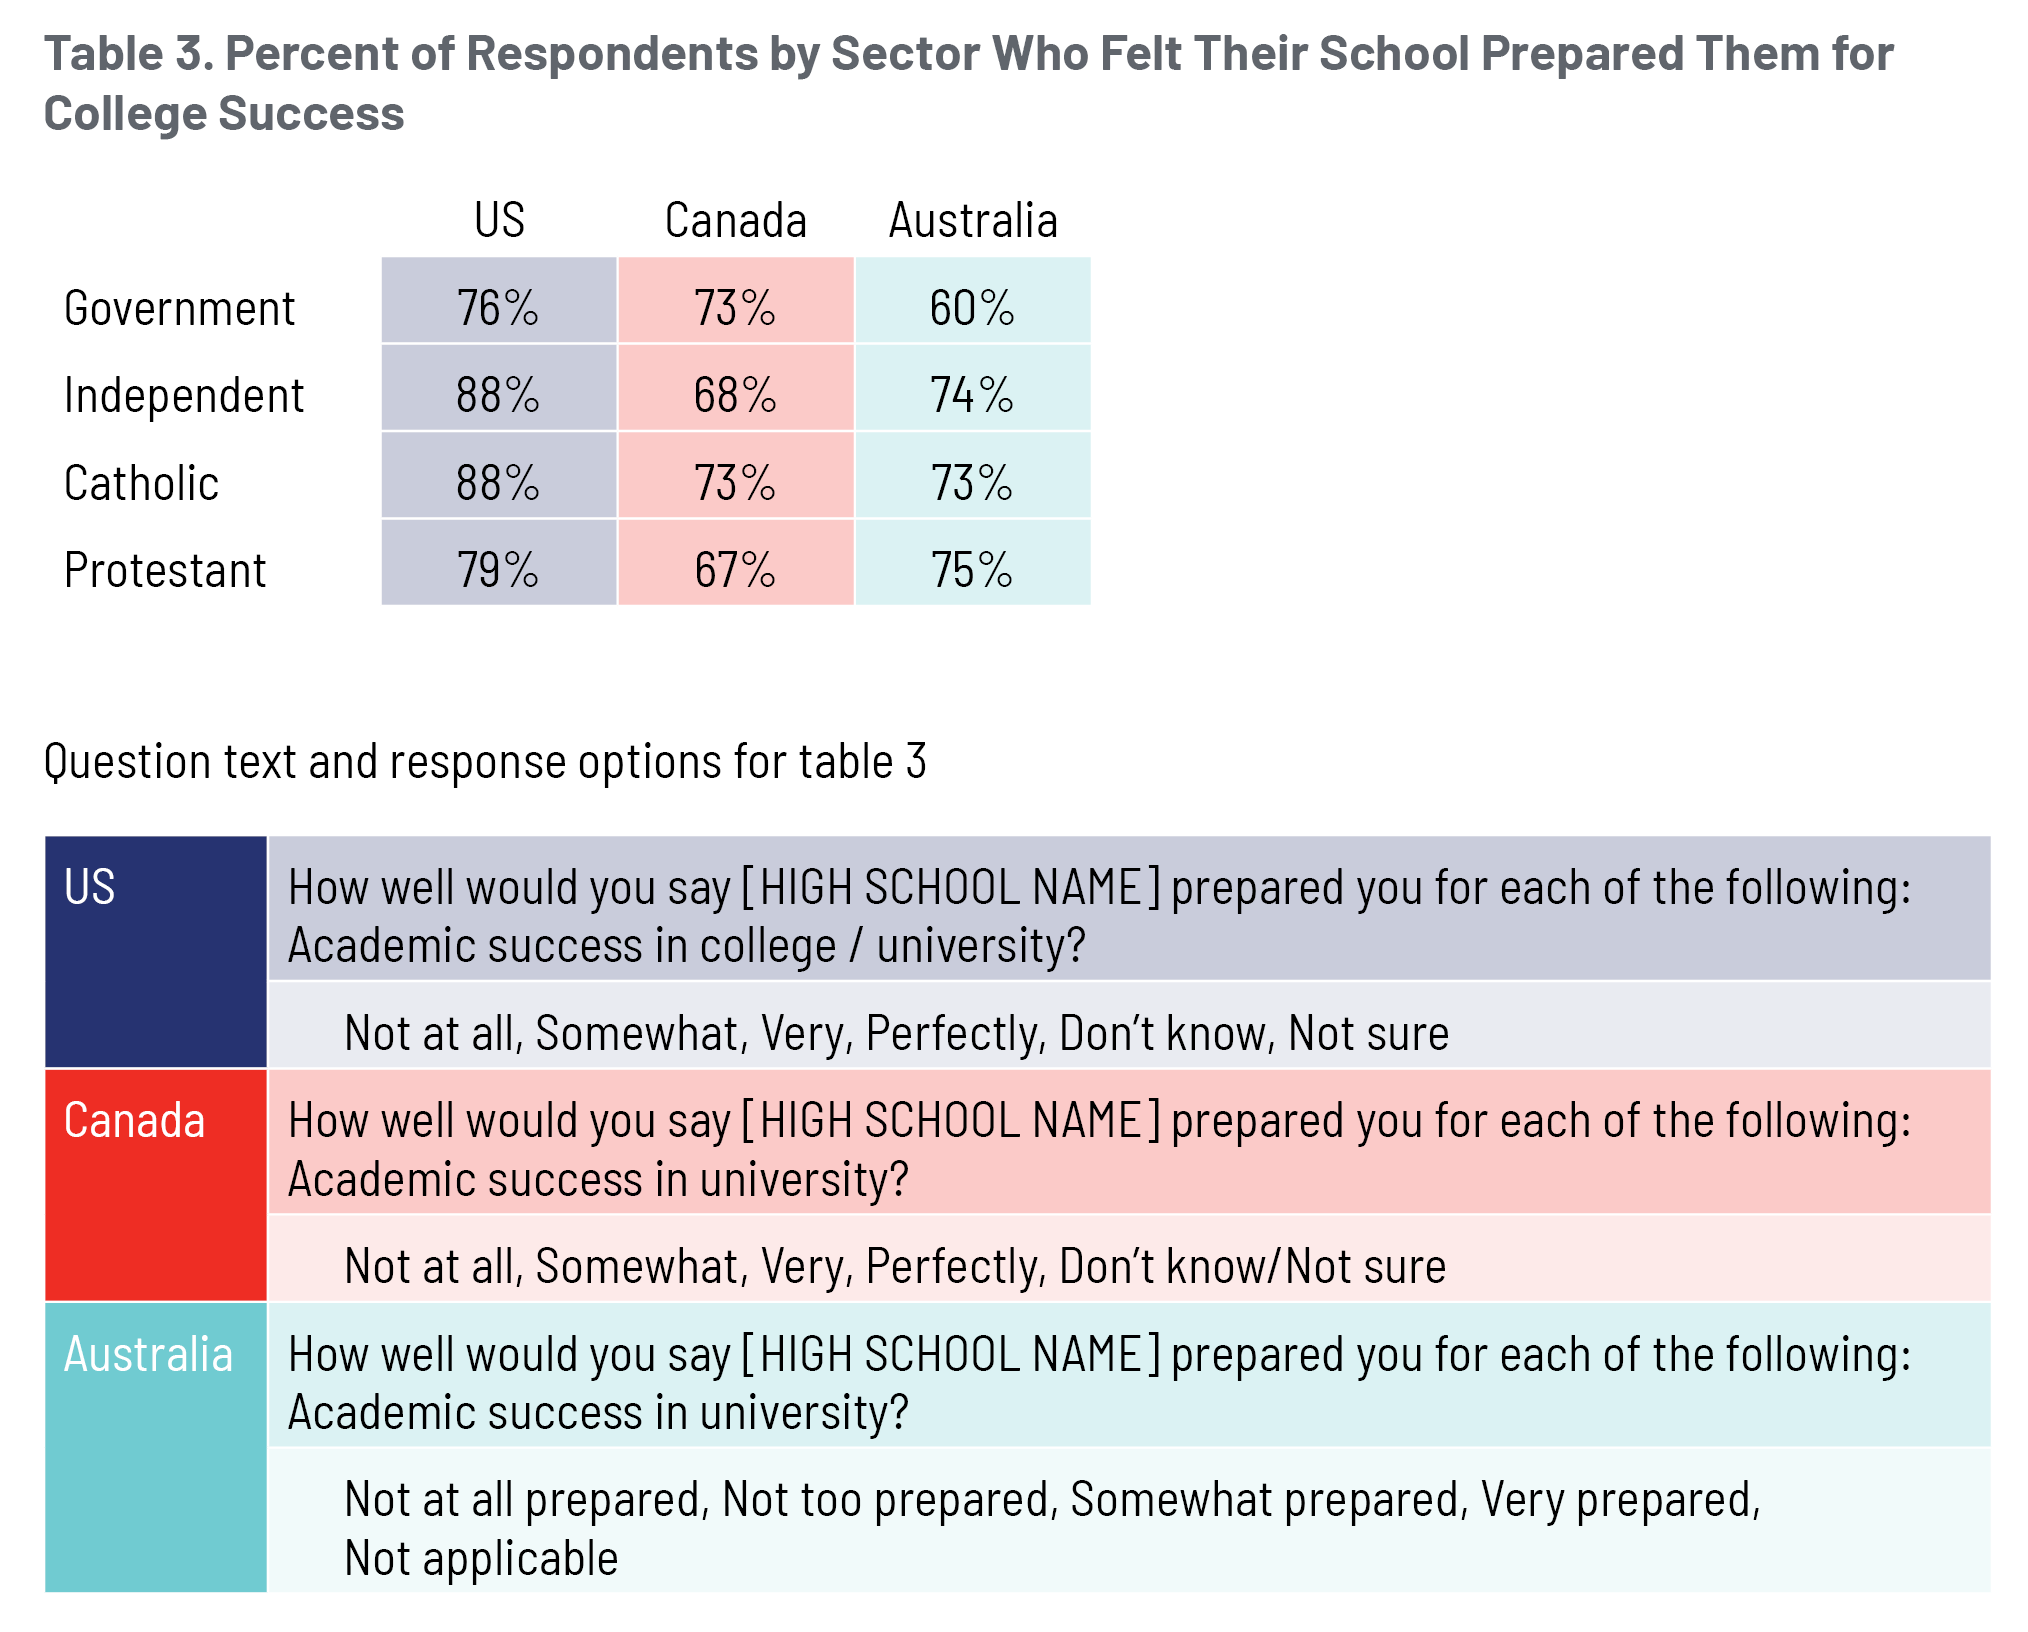
Some country-level averages, however, mask variation within specific school sectors. For example, in the full sample, Australian respondents, on average, were less likely than American and Canadian respondents to report feeling at least somewhat prepared for success in college. However, when considering Catholic-school respondents only, Australians were noticeably more likely to feel prepared by their school for that aspect of adulthood. In fact, the 73 percent of Australian Catholic-school graduates who expressed this opinion is as high as the percentage of Canadian Catholic-school graduates who did the same. Furthermore, the three-quarters of Australian Protestant- and independent-school graduates who felt at least somewhat prepared for post-secondary success is higher than the approximately two-thirds of Canadian Protestant- and independent-school graduates who felt the same. These sector-specific findings regarding preparedness for post-secondary schooling are shown in figure 3.
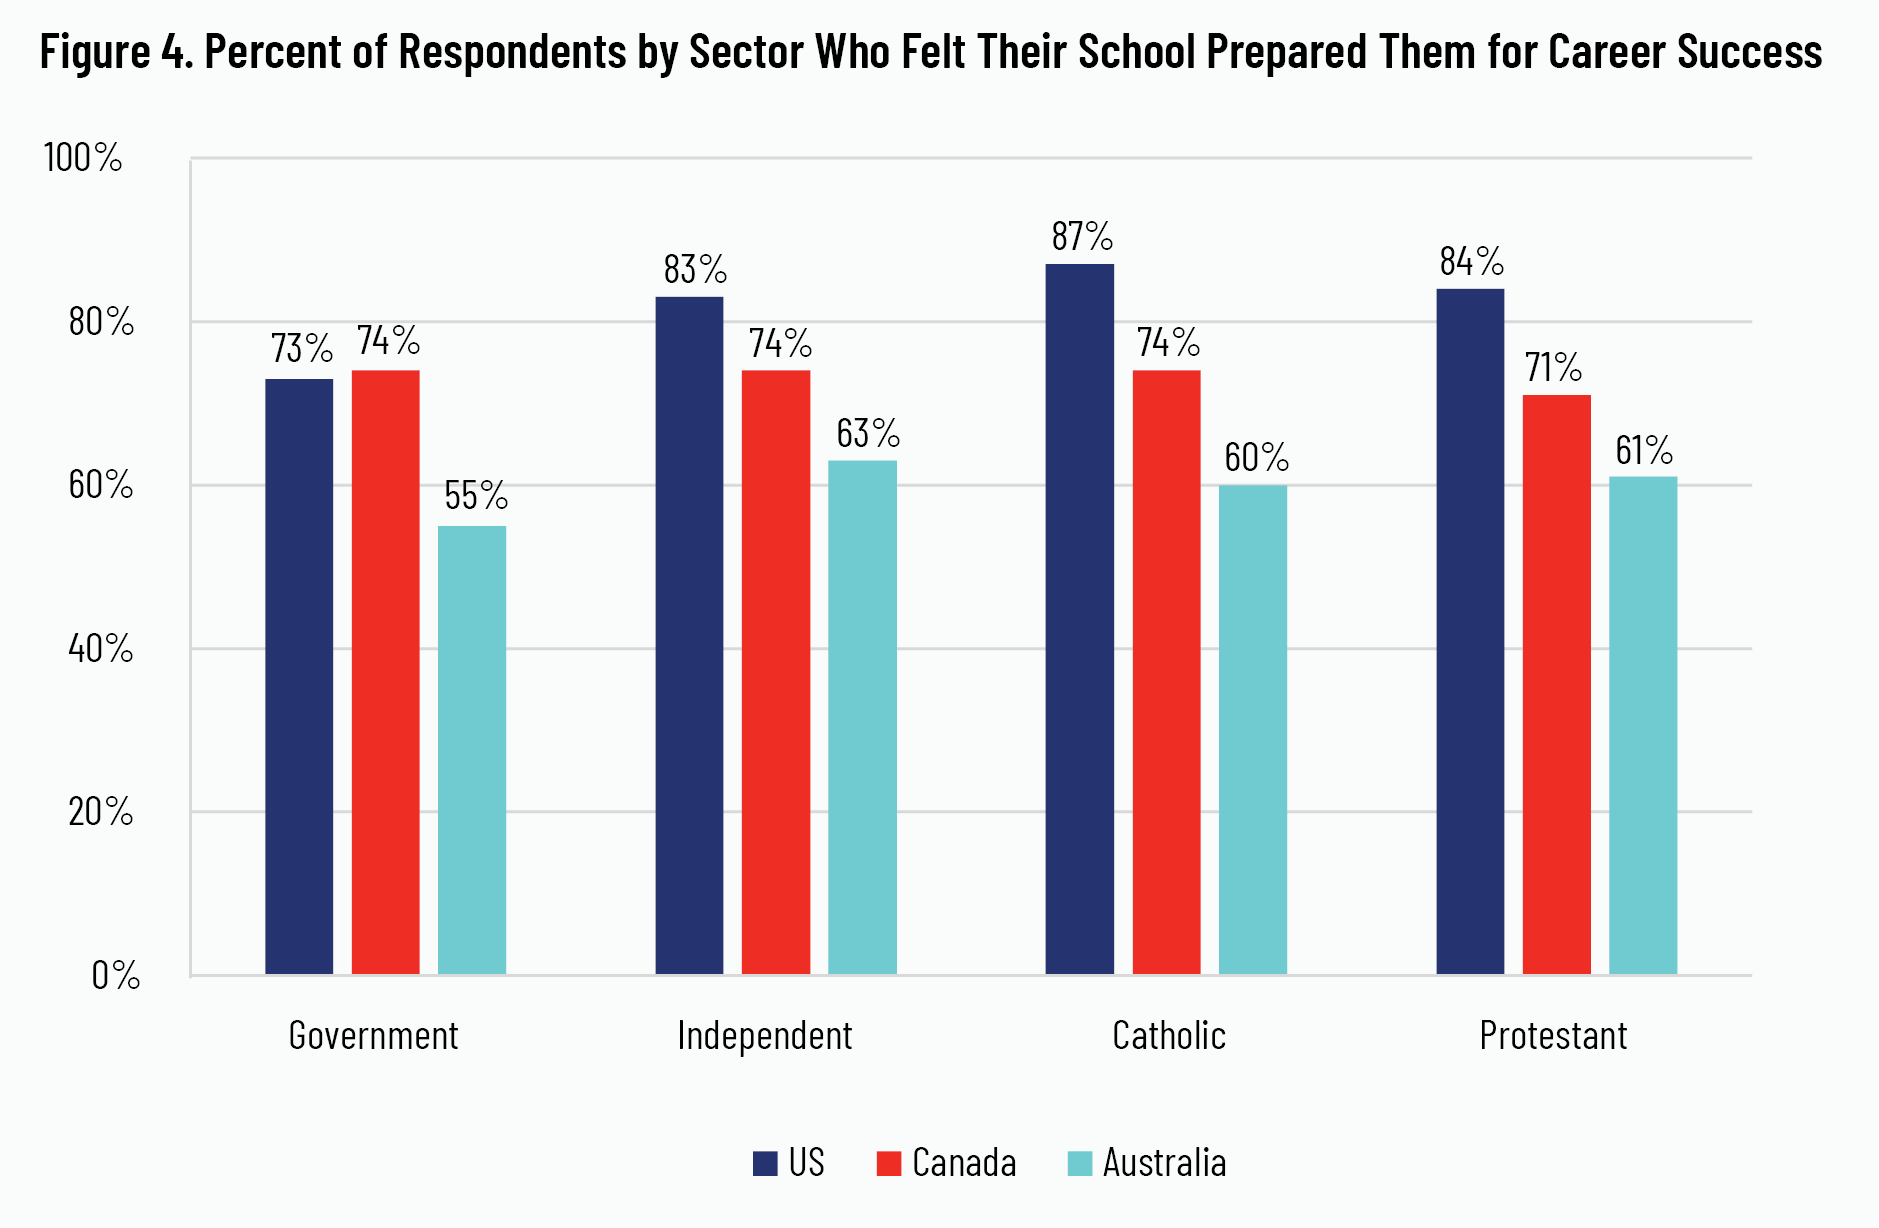
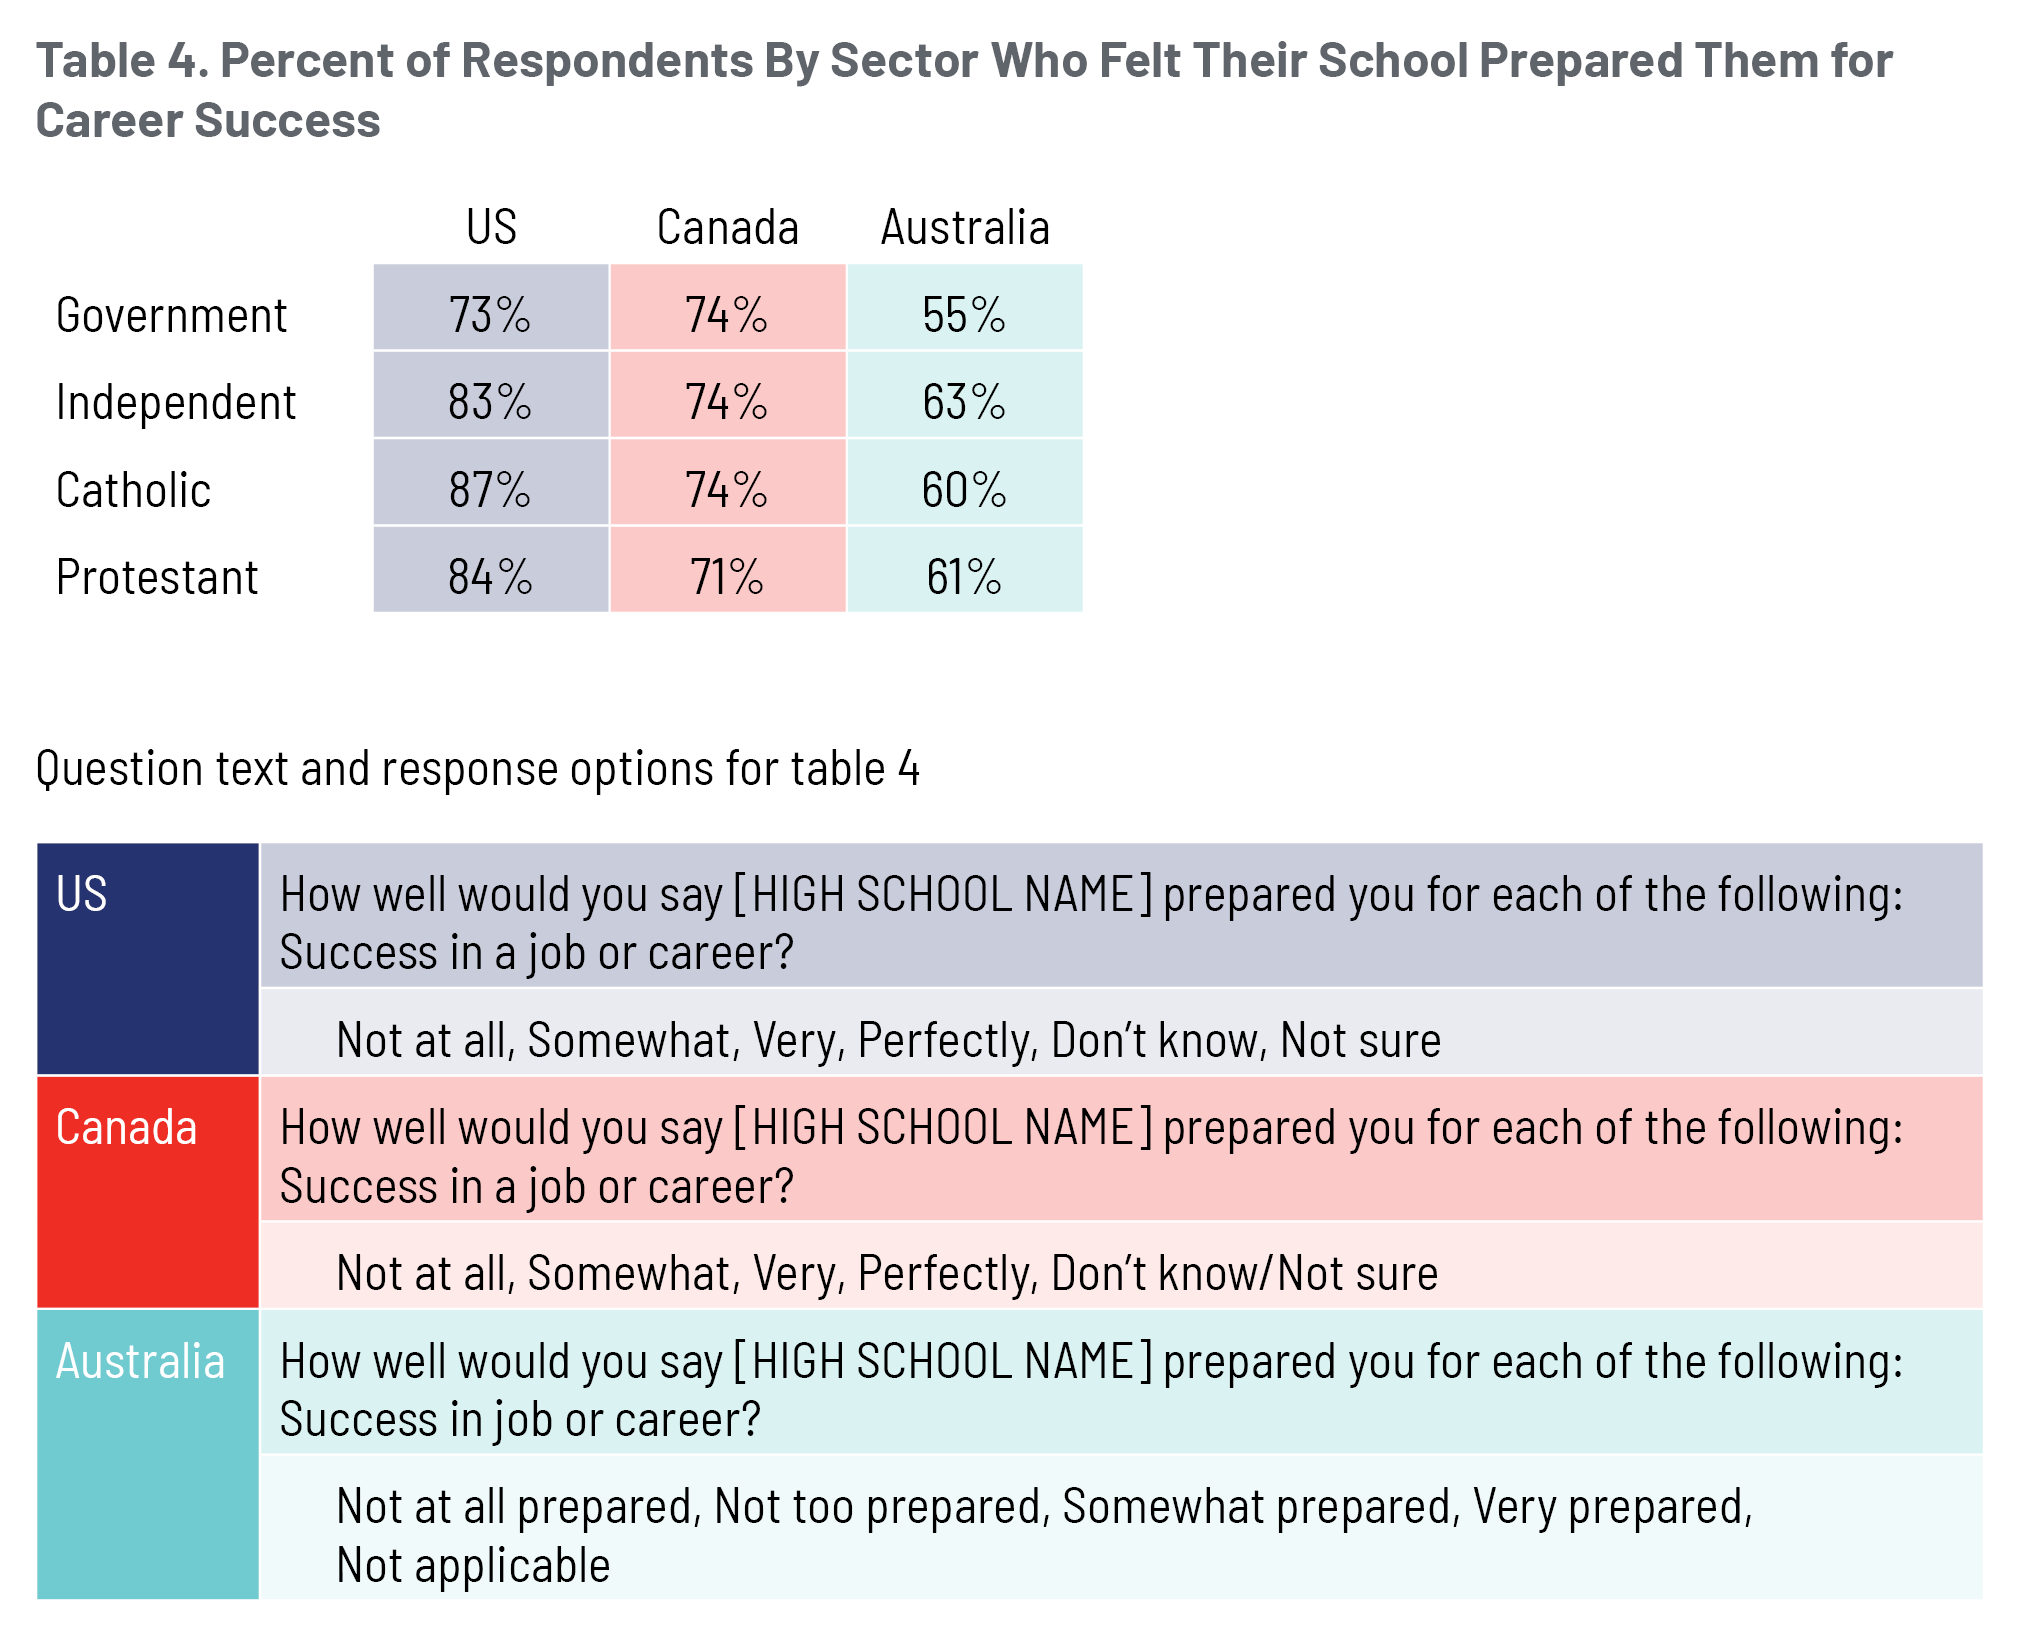
Considering preparation for career success by school sectors, we observe trends similar to the results based on country-level aggregates in figure 2. The majority of the graduates from all the school sectors in the three countries agreed that their schools prepared them well for career success, with American and Canadian graduates feeling more prepared than Australian graduates. Over four out of every five US graduates from independent schools reported feeling prepared for career success. This proportion is higher than the proportion reported by independent graduates in not only Australia but also Canada. However, a similar proportion of Canadian and American government-school graduates felt prepared for career success. These results are shown in figure 4.
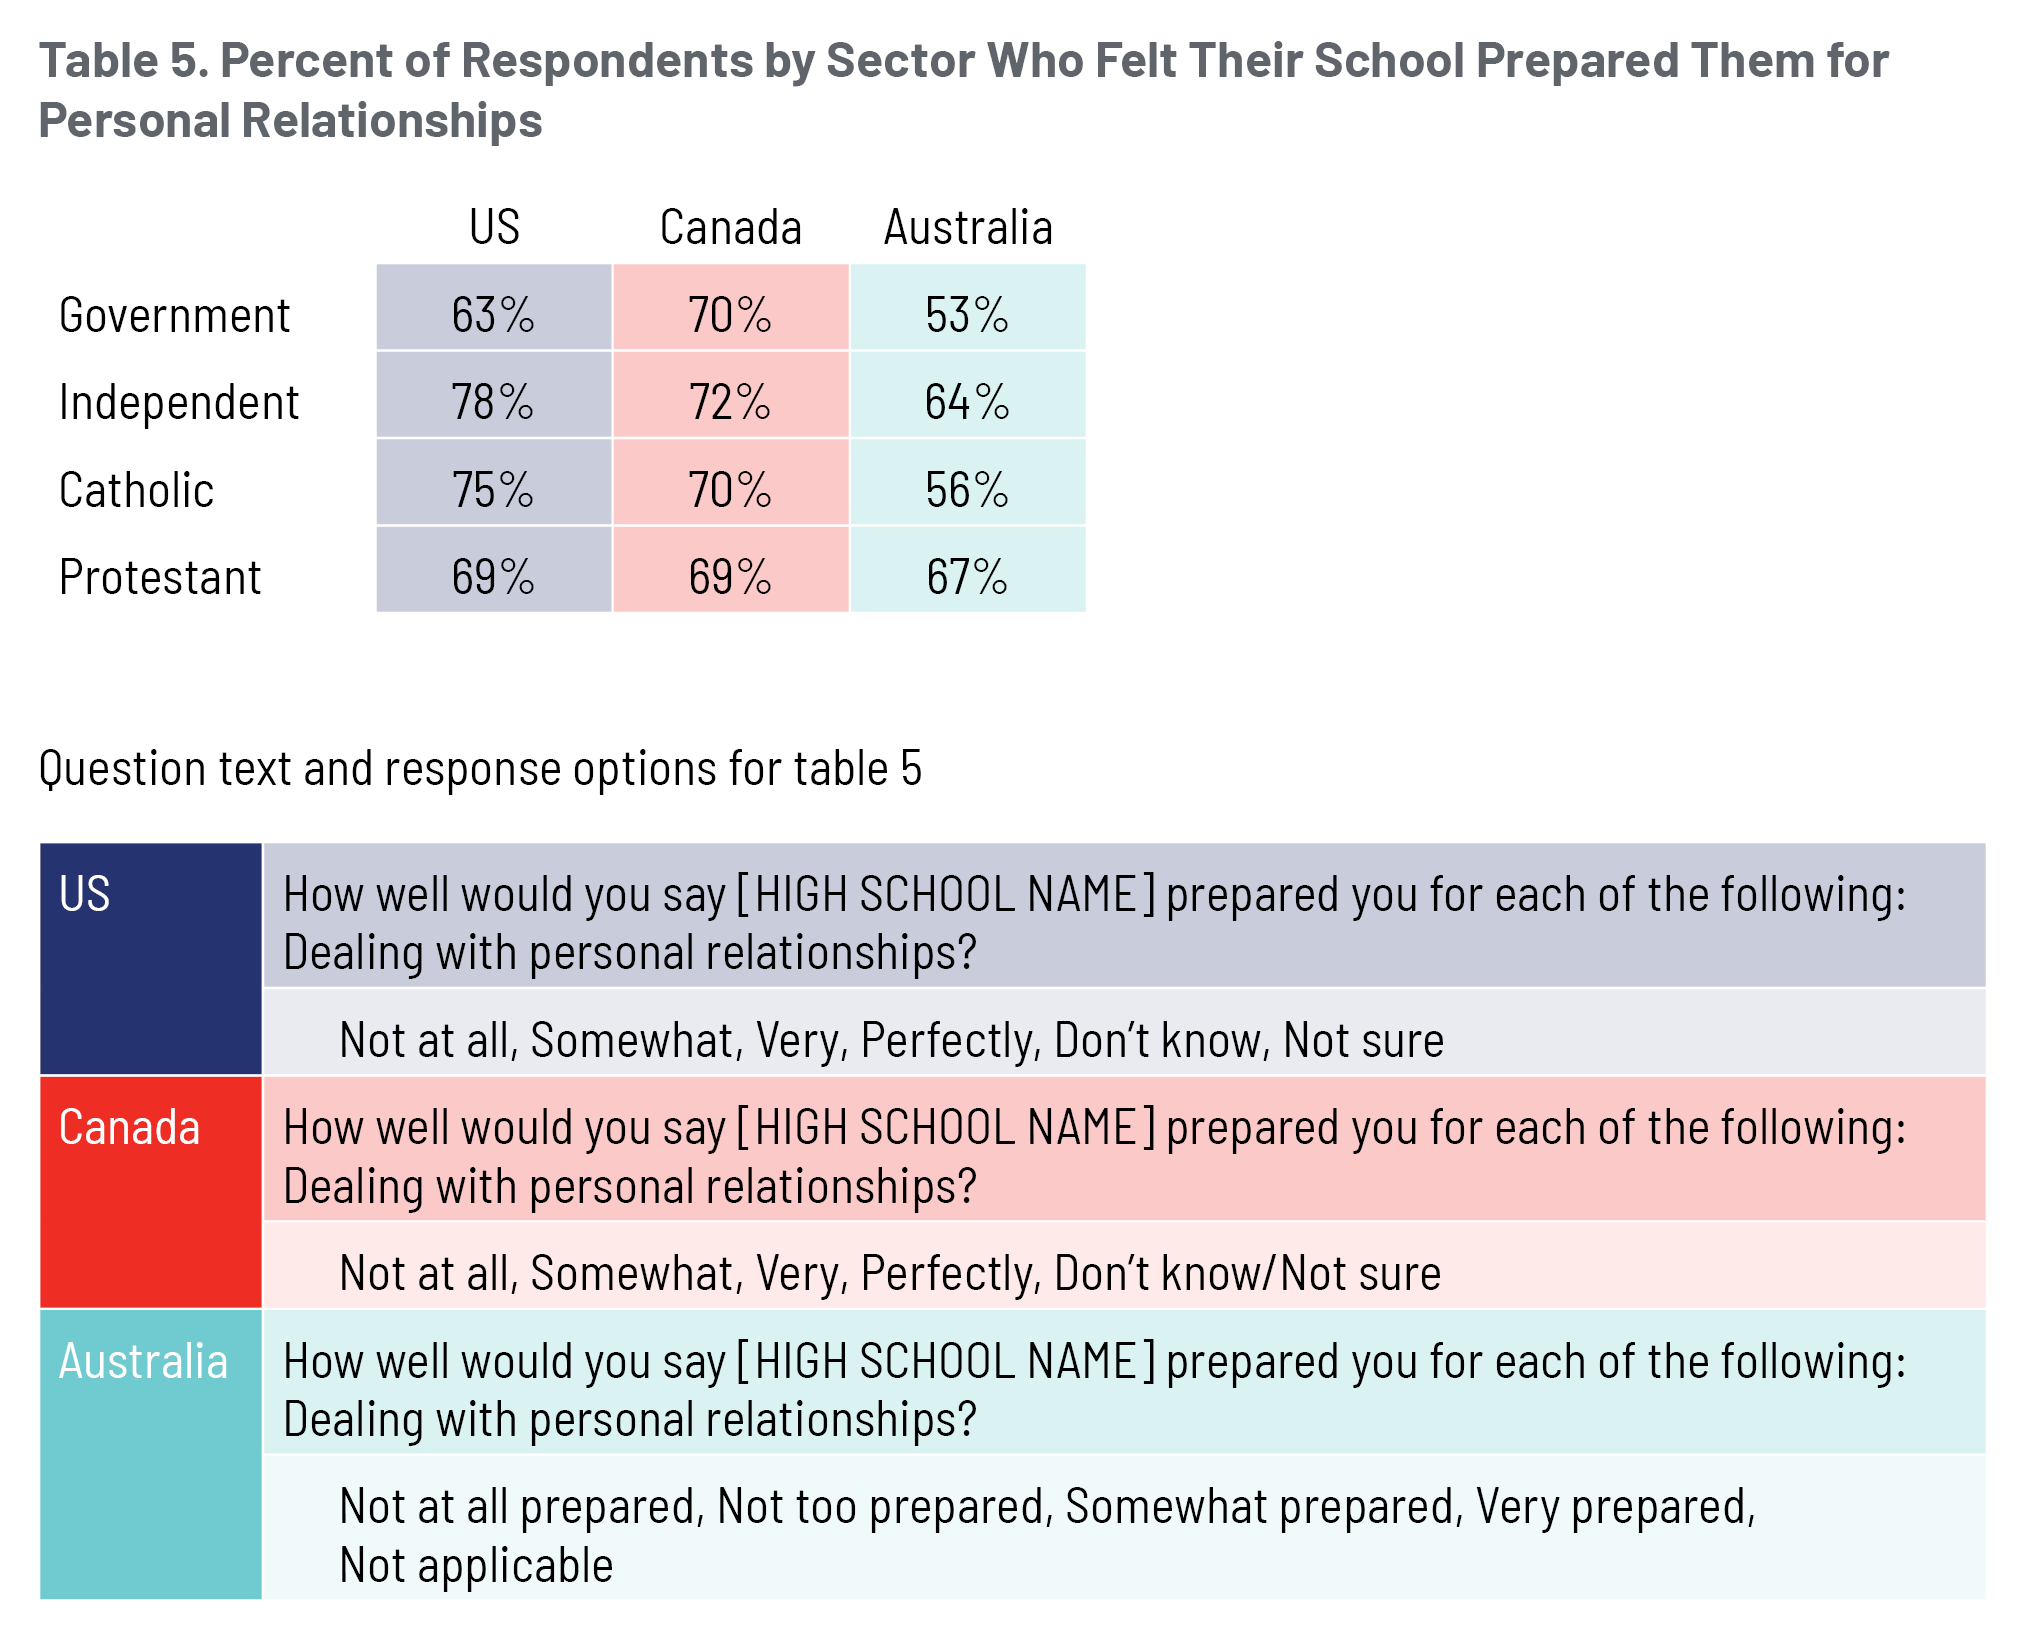
In figure 5, we display the proportion of respondents in the three countries and by school sector who felt “somewhat,” “very,” or “perfectly” prepared for dealing with personal relationships. The results for the Government-school sector mimic the results for Canada as a whole, with Canadian graduates most likely to report the highest levels of preparation in this aspect of schooling. However, among Catholic- and independent-school graduates, a greater proportion of American respondents reported feeling prepared for dealing with personal relationships compared to Canadian respondents. Moreover, among Protestant-school graduates, Australian respondents appear just as likely as American and Canadian Protestant-school respondents to report feeling prepared for dealing with personal relationships. This sentiment was shared by two-thirds of Protestant-school graduates in all three countries. With only slightly more than half of Australians graduating from Catholic and government schools who indicate being prepared for dealing with personal relationships, what might Australian Catholic and government schools glean from their nation’s Protestant-school sector for addressing their students’ relational needs?
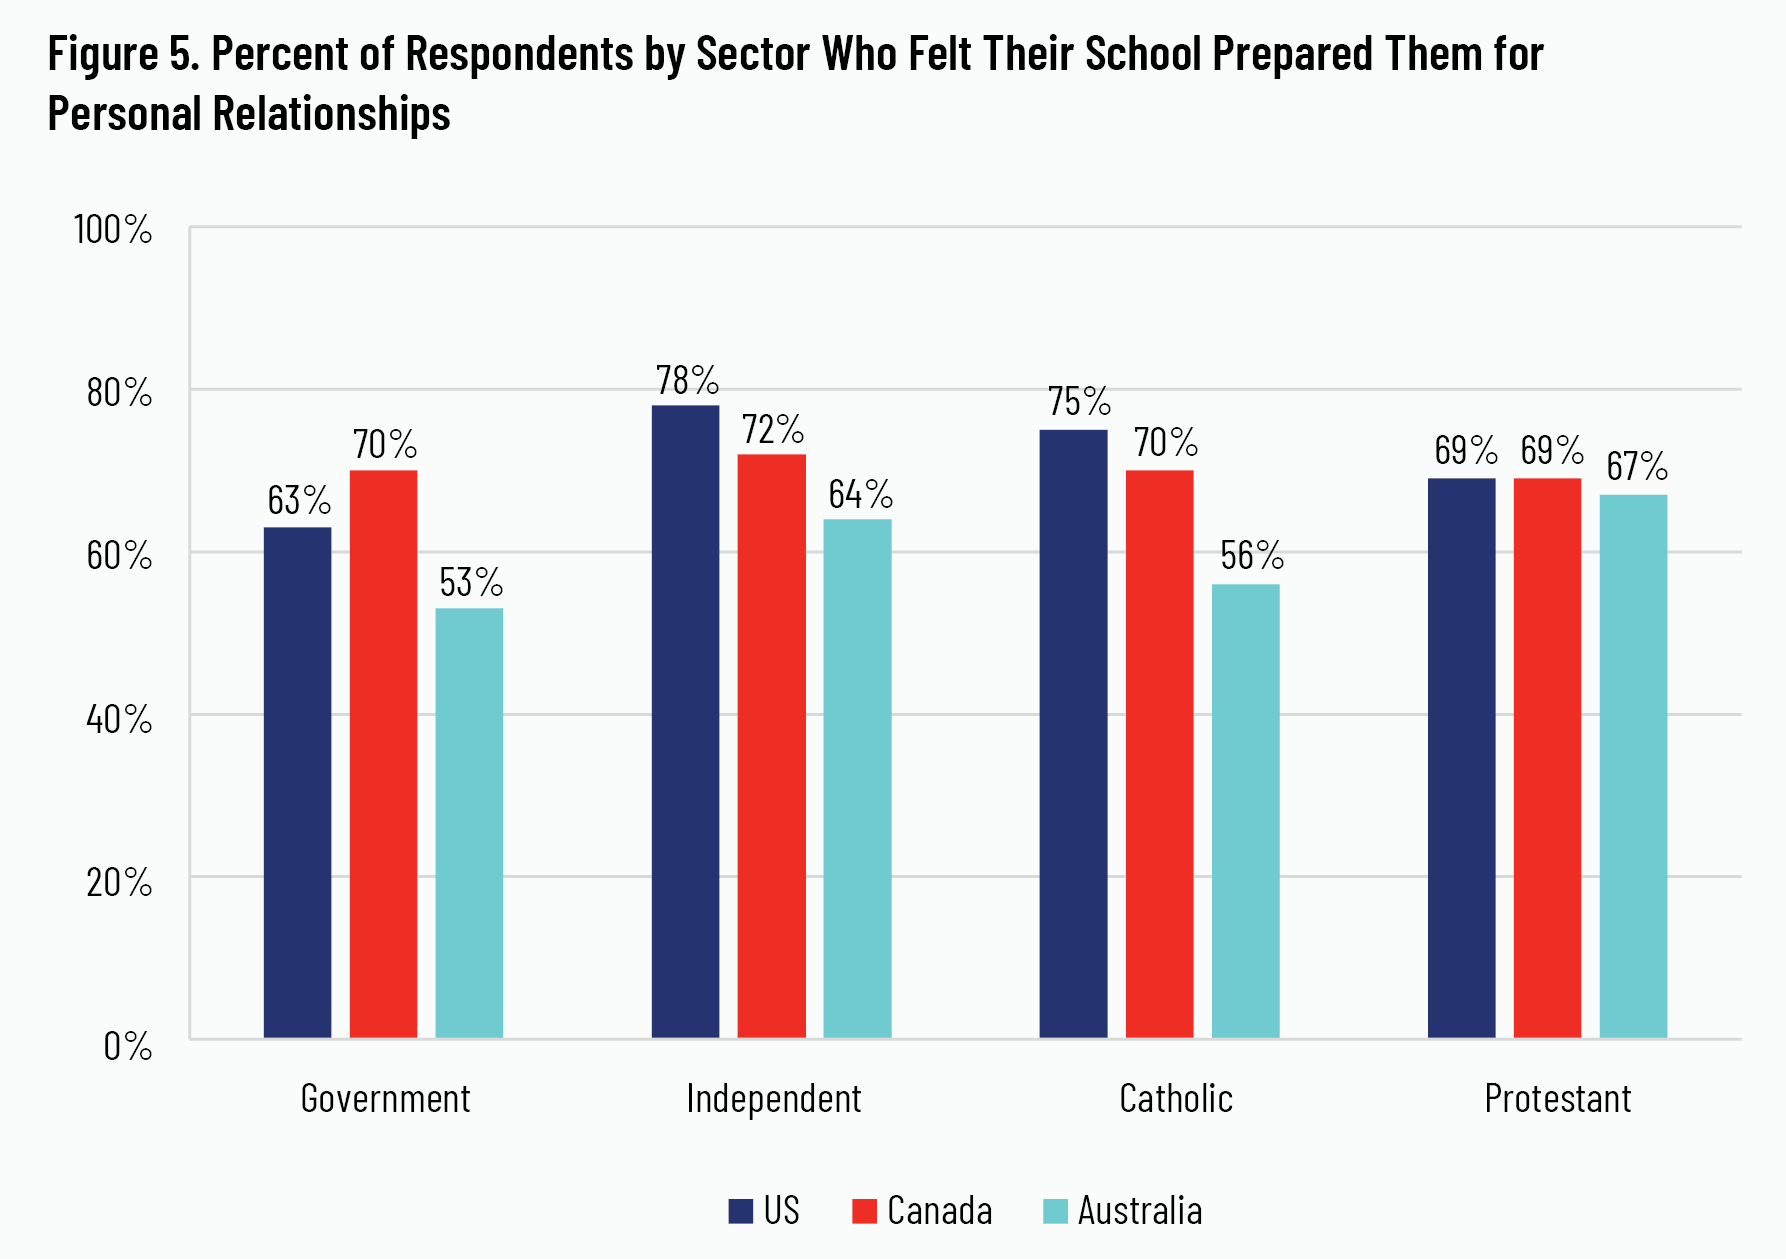
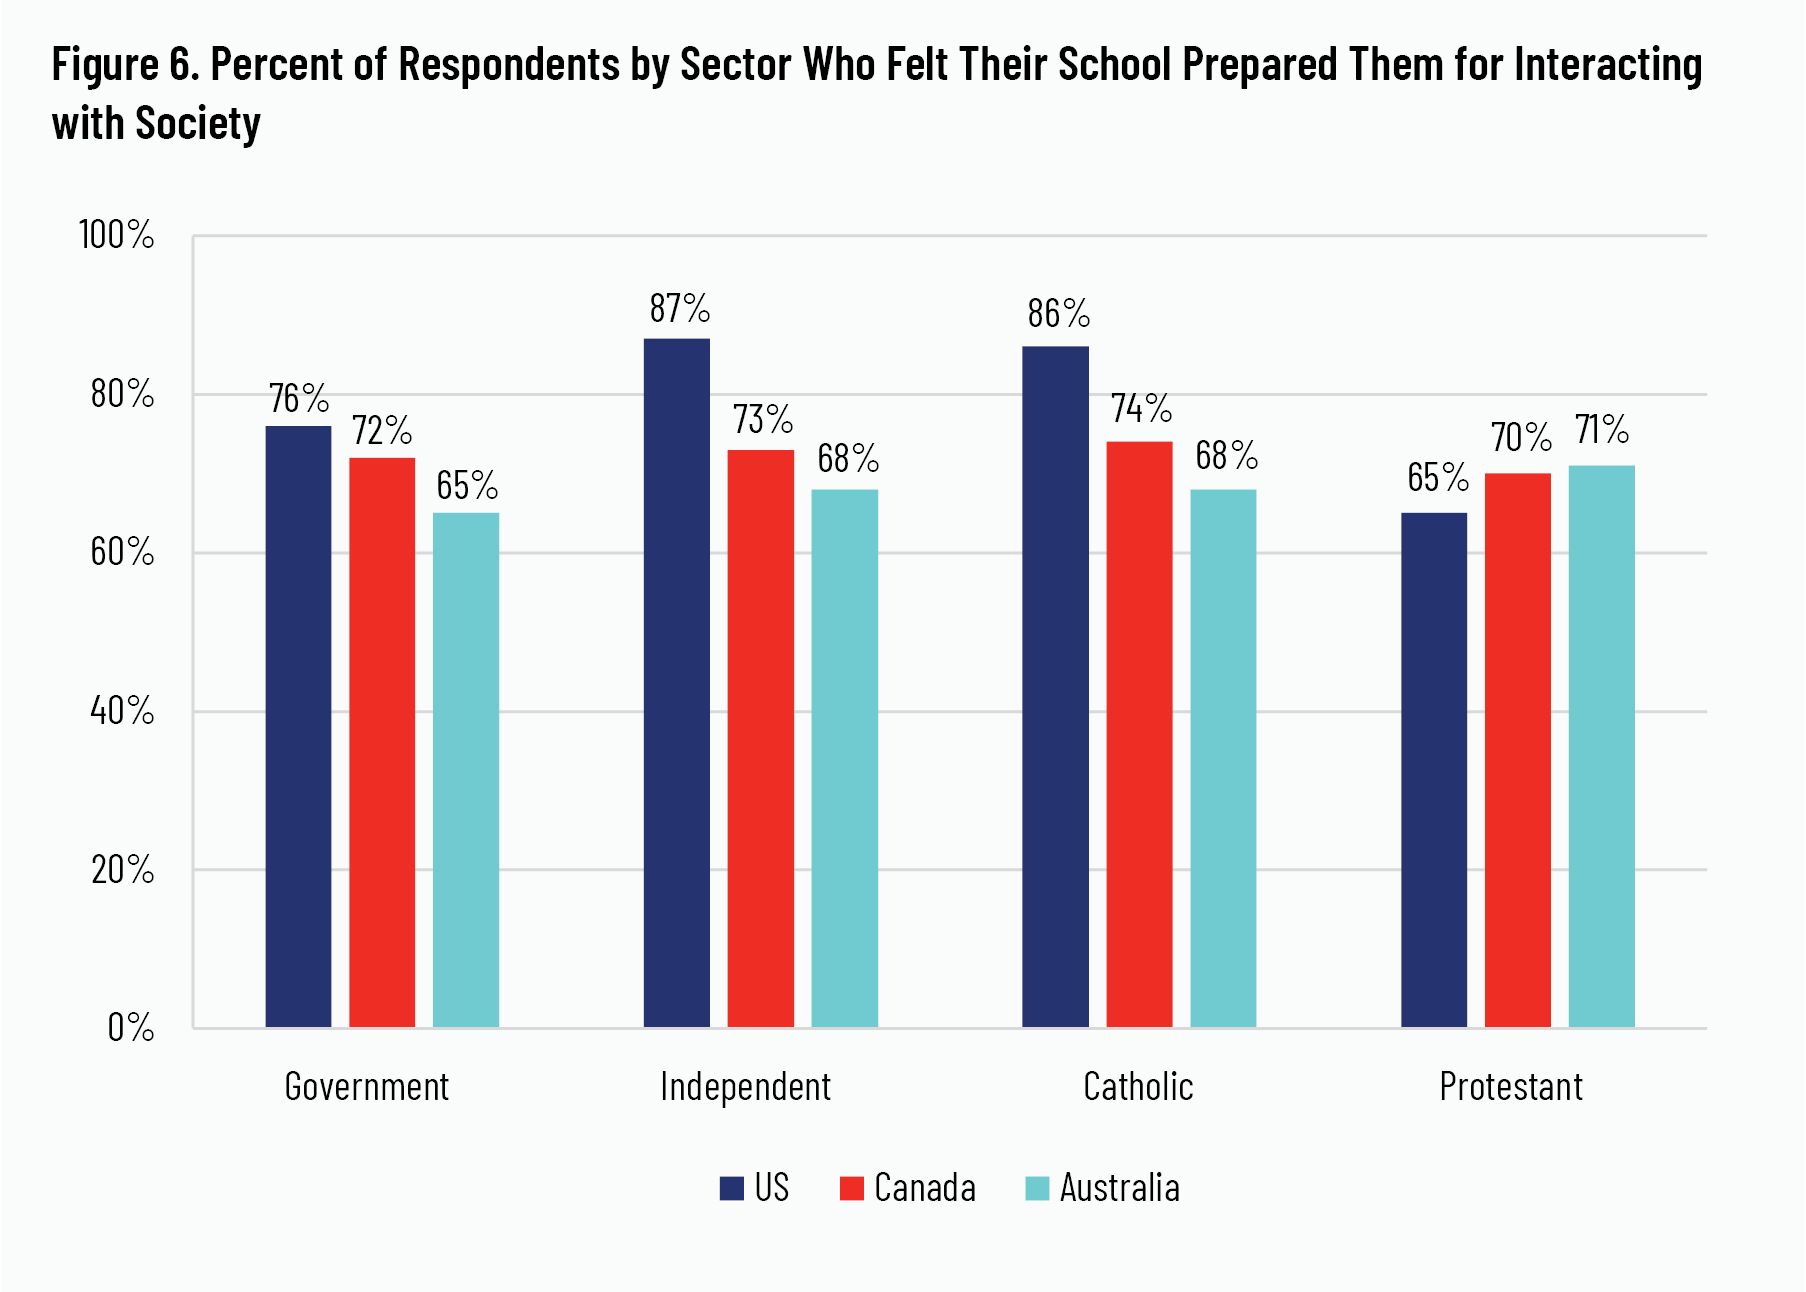
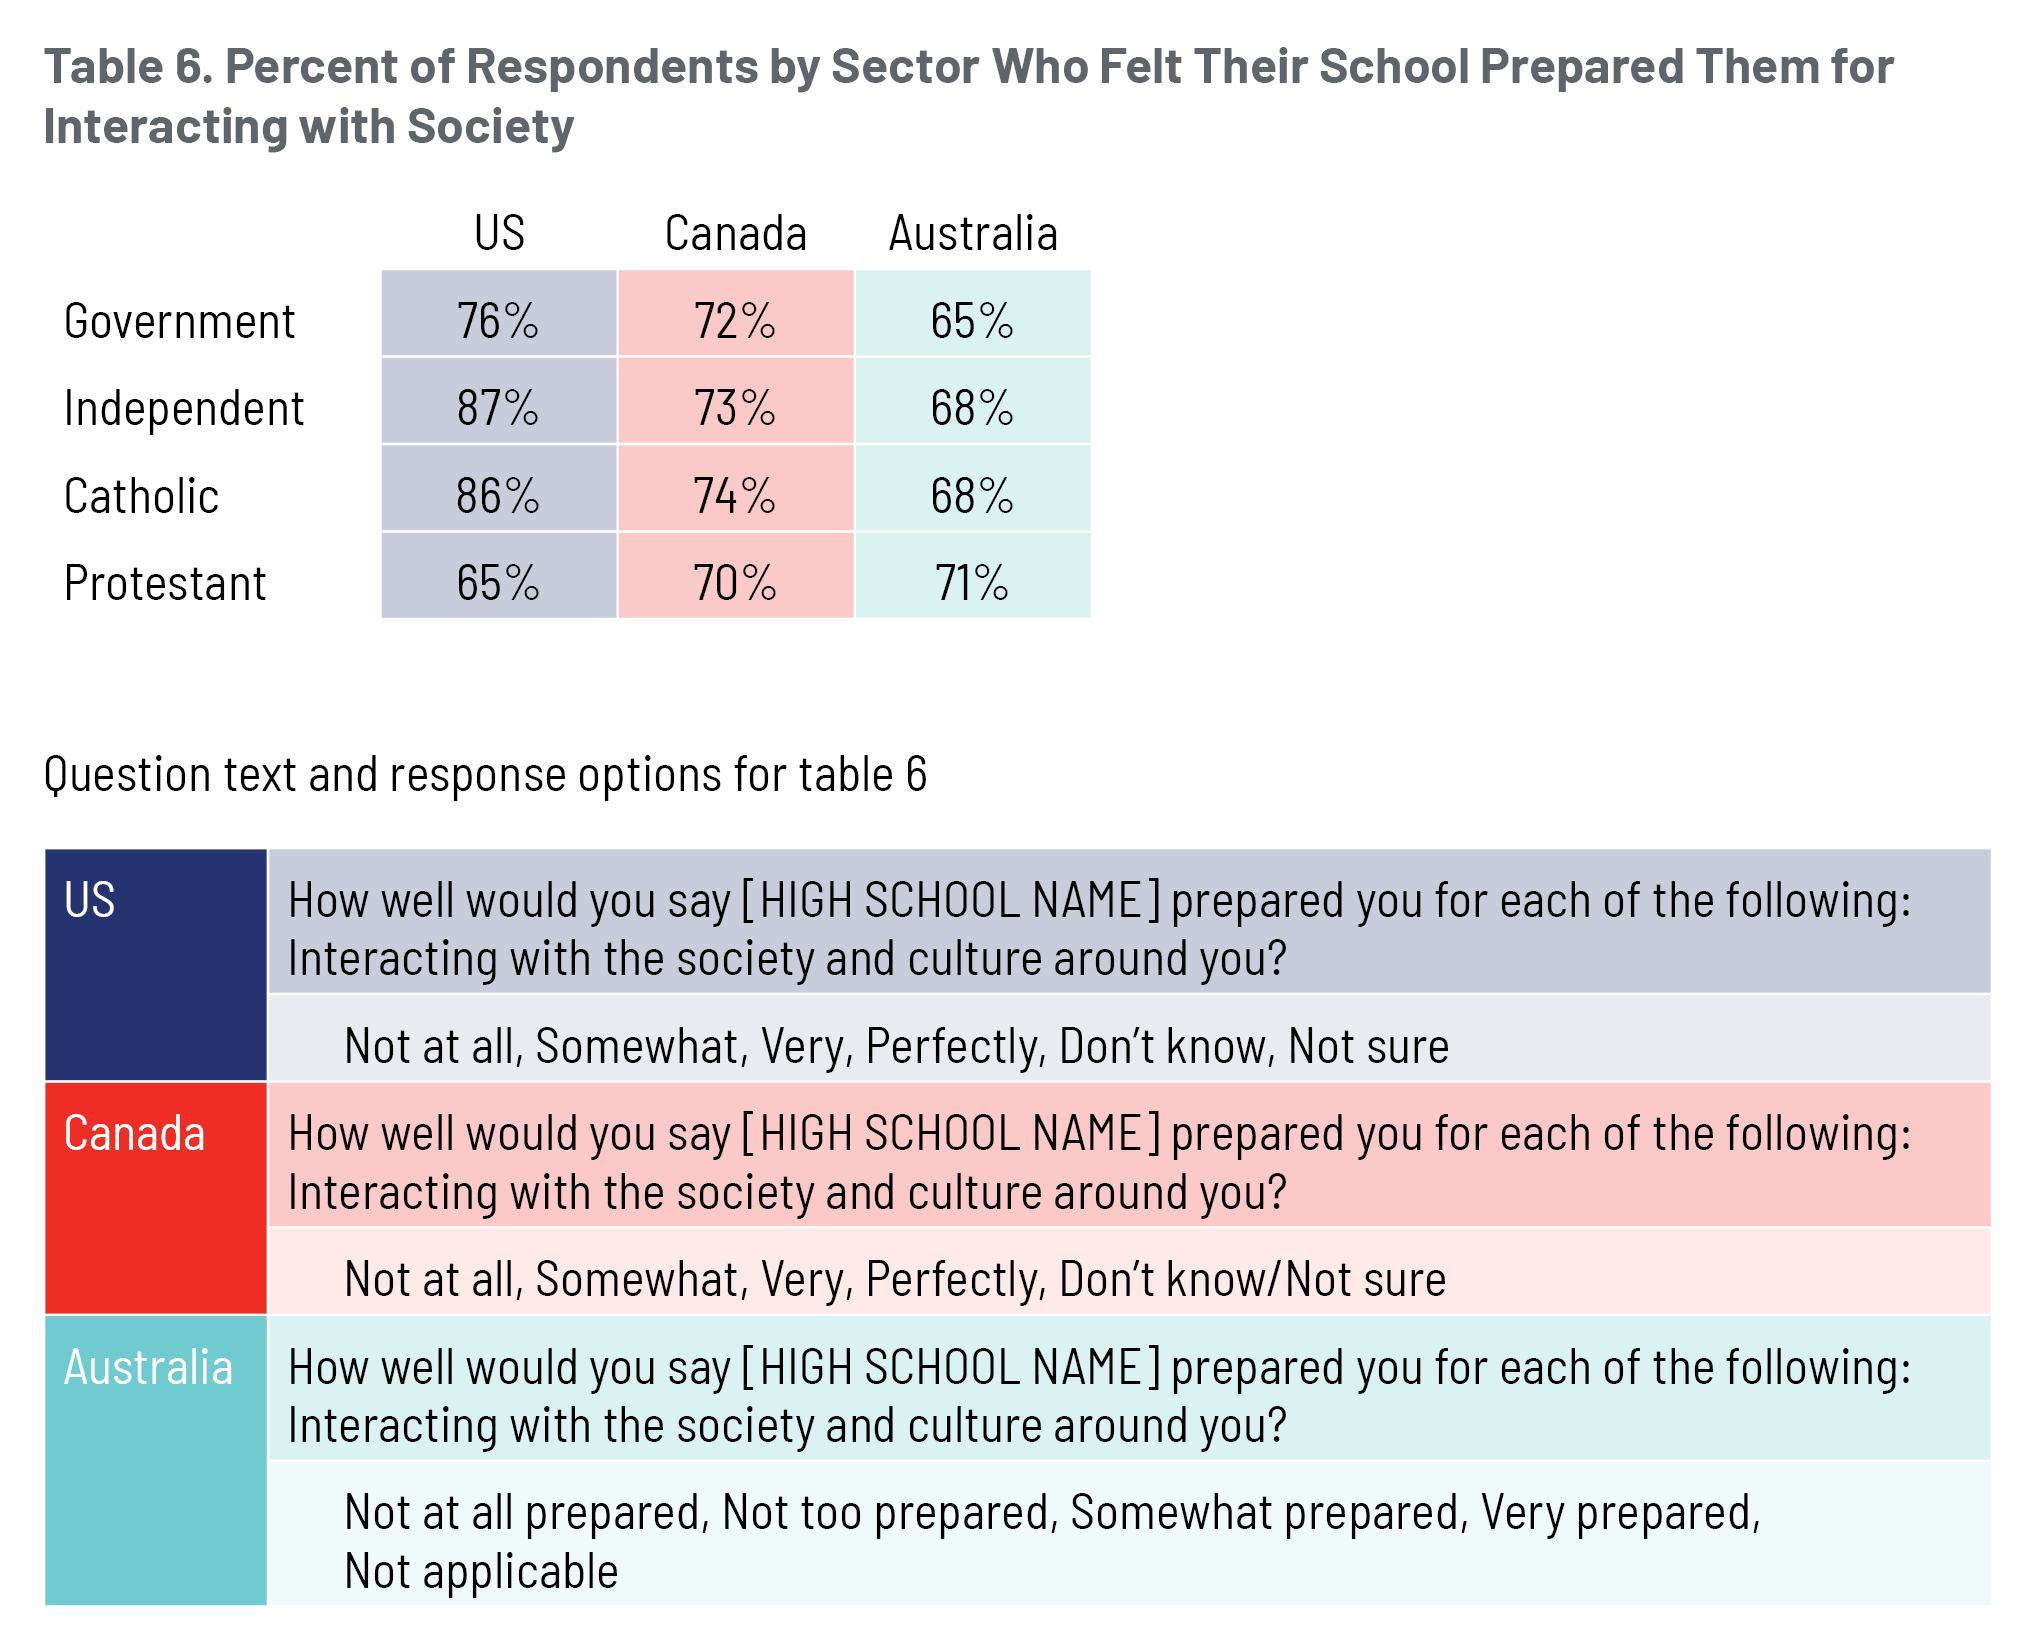
Figure 6 shows results for how prepared graduates across the four school sectors felt for interacting with society. In the country-level results in figure 1, US graduates were more likely than graduates in Canada and Australia to report feeling prepared for this aspect of life. Considering the results separately by school sector, we now see that these differences are mainly driven by the Catholic- and Independent-school sectors, where nearly 90 percent of US graduates from these sectors felt “somewhat,” “very,” or “perfectly” prepared for interacting with society. In contrast, the pattern reverses when considering Protestant-school graduates. Specifically, around 70 percent of Canadian and Australian Protestant-school graduates felt at least somewhat prepared for interacting with the surrounding culture and society compared to 65 percent of American Protestant-school graduates. What might explain this pattern of results? What, if anything, might American Protestant schools learn from Canadian and Australian Protestant schools or American Independent and Catholic schools in preparing students to interact with their surrounding culture and society?
2. Civic Engagement
Do graduates engage with the communities in which they live? Do they establish social ties and how do they love their neighbours? There are endless ways graduates might maintain an outward, generous posture toward their cities, towns, and neighbourhoods. Prior waves of the Cardus Education Survey have queried respondents about their voting and whether they belong to churches, charities, political organizations, social groups that unite around a common hobby, and other organizations that sustain civic life. These and many other practices are crucial for seeking the flourishing of their communities.
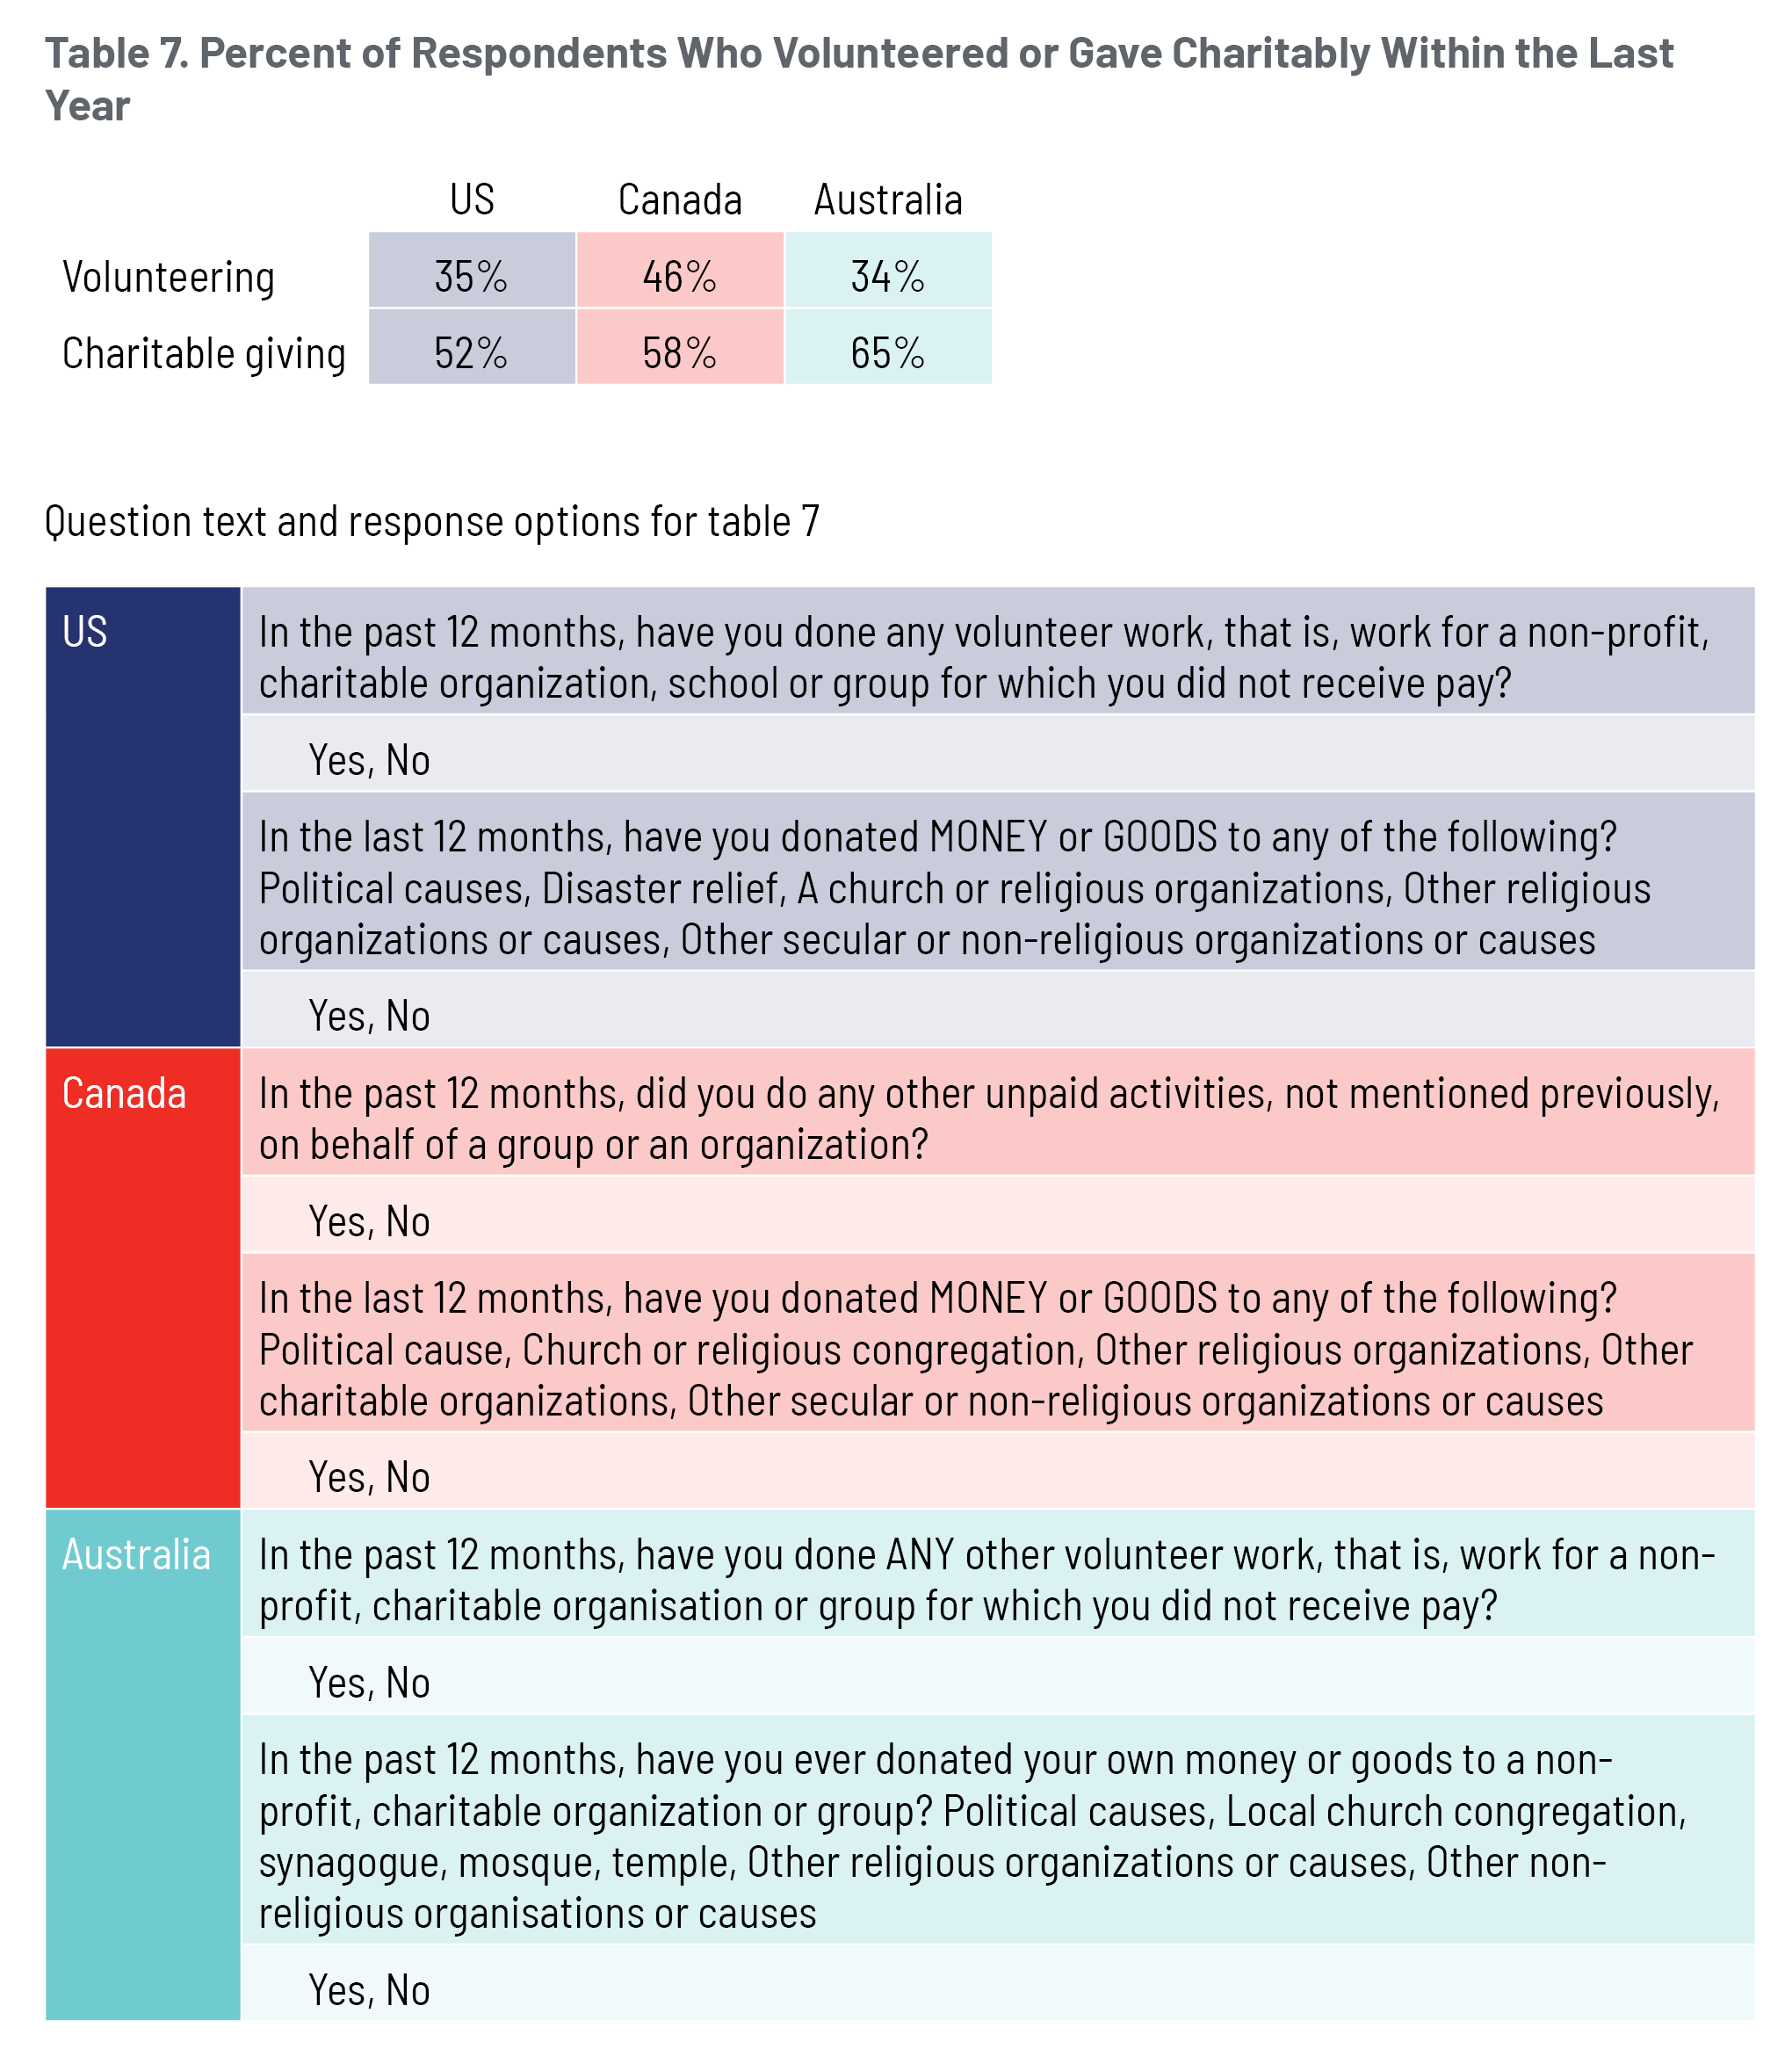
In this report, we focus on the two civic practices that were included in all three versions of the Cardus Education Survey administered to the US, Canada, and Australia: volunteering and charitable giving. Before presenting the results, we note that to obtain this data, the Canadian administration of the Cardus Education Survey relied on a slightly different approach than the American and Australian survey administrations. Specifically, the versions of the Cardus Education Survey administered in the US and Australia ask, “In the past 12 months, have you done any volunteer work, that is, work for a non-profit, charitable organization, school or group for which you did not receive pay?” However, on the Cardus Education Survey administered in Canada, respondents were provided a list of activities (e.g., coaching, collecting food, fundraising, door-to-door canvassing, counselling) and asked if they did any of those specific activities without pay within the last twelve months. Because Canadian respondents were reminded of a series of activities, their rates of civic engagement may be biased upward relative to American and Australian respondents.
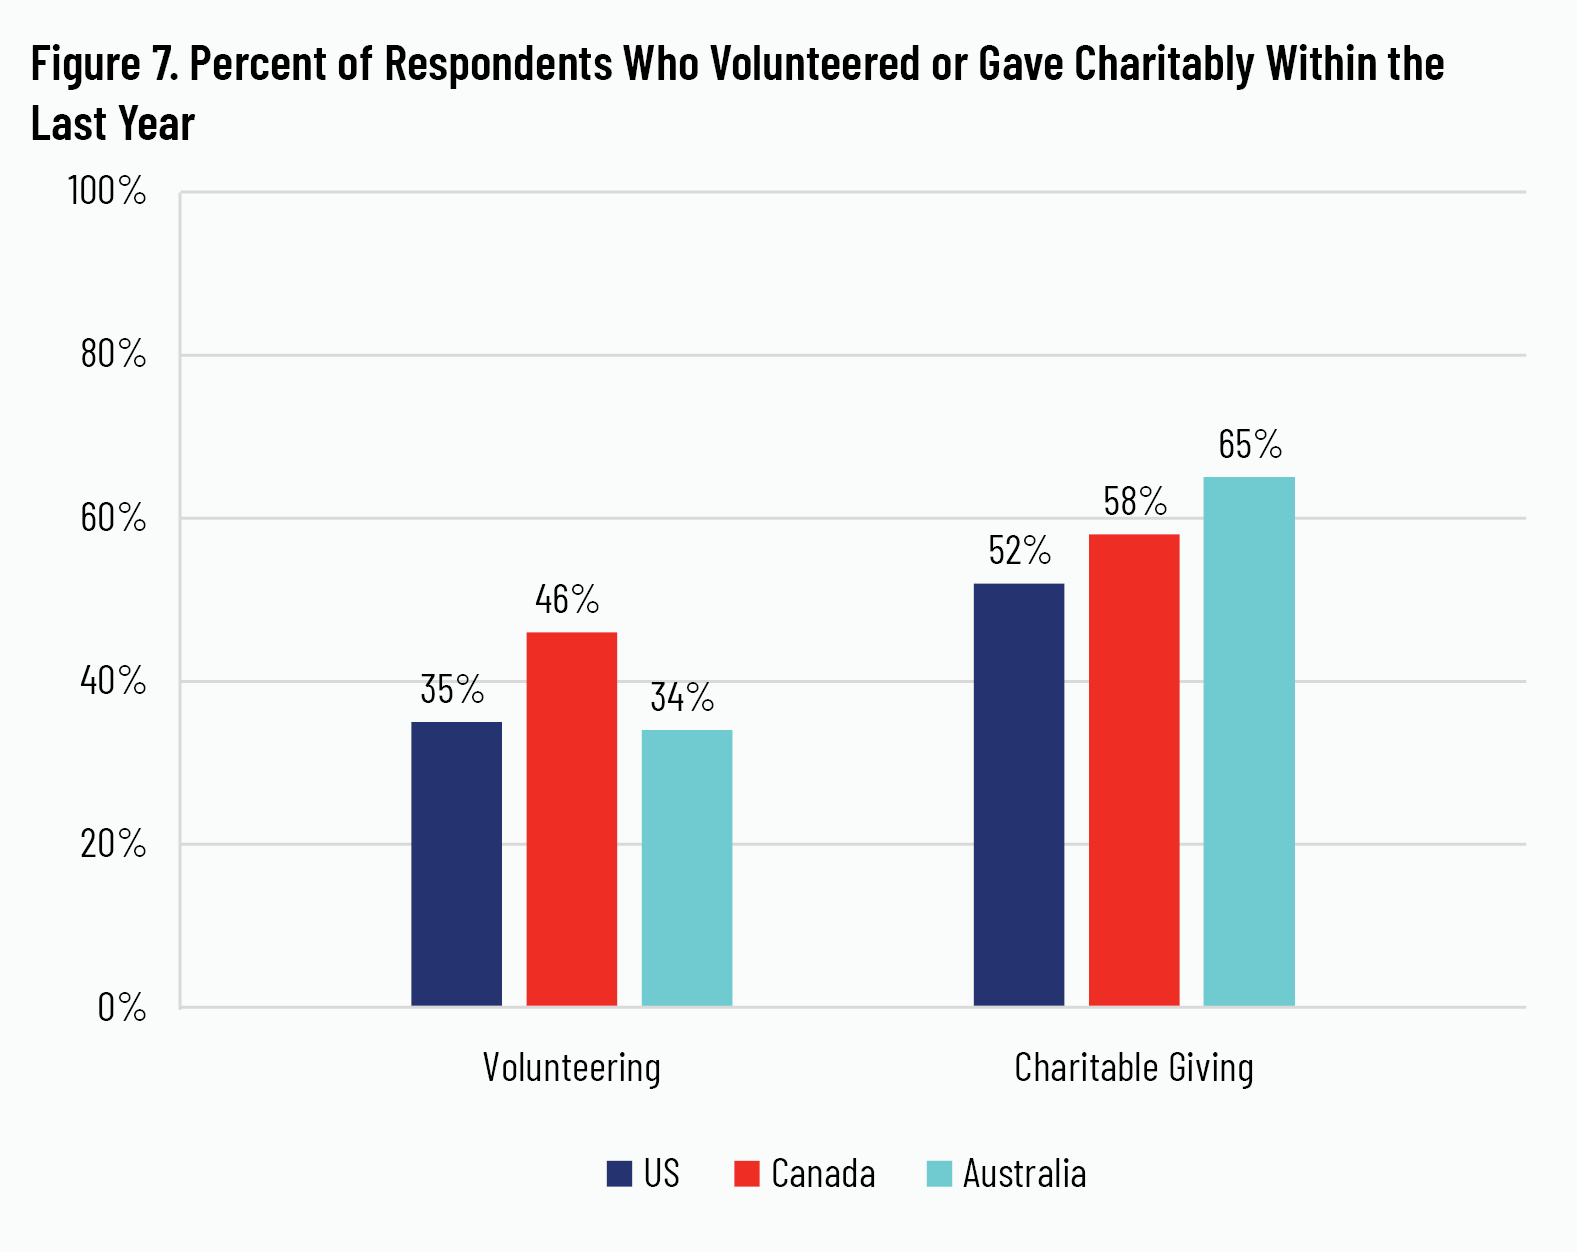
When asked if they had done any volunteer work—that is, work without pay on behalf of an organization—within the last twelve months, 46 percent of Canadians replied affirmatively. This rate is higher than the rate reported by Australian and American respondents, where just over one-third of respondents reported volunteering. These results are shown in figure 7.
Figure 7 also displays the findings regarding charitable giving. Respondents in all three countries were more likely to give charitably than to volunteer. About two-thirds of Australian respondents indicated donating “money or goods to a non-profit, charitable organization or group.” The proportion of American respondents is lowest at 52 percent, while the proportion among Canadian respondents is 58 percent. These findings are worth investigating in more detail, given that Canadians, in general, are the least likely of the three to donate money and volunteer their time. 33 33 Charities Aid Foundation, “CAF World Giving Index 2018: A Global View of Giving Trends,” Charities Aid Foundation, October 2018, 11, https://www.cafonline.org/docs/default-source/about-us-publications/caf_wgi2018_report_webnopw_2379a_261018.pdf. Importantly, there are also differences in the culture of giving. Less than two out of ten Canadian households and fewer than three out of ten Australian households claim charitable donations on their annual tax filings, 34 34 Canada Helps, “The Giving Report 2021: Faster Growth in Online Giving Crucial During Times of Crisis,” Canada Helps and Environics Analytics, 2021, 35, https://www.canadahelps.org/media/The-Giving-Report-2021_EN.pdf; M. Mcgregor-Lowndes, M. Balczun, and A. Williamson, “An Examination of Tax-Deductible Donations Made by Individual Australian Taxpayers in 2018–19: ACPNS Working Paper No. 74,” The Australian Centre for Philanthropy and Nonprofit Studies, Queensland University of Technology, 2021, 6, https://eprints.qut.edu.au/212682/9/An_examination_of_tax_deductible_donations_made_by_individual_Australian_taxpayers_in_201819.pdf. while six out of ten American households do—and at over twice the volume per household. 35 35 Philanthropy Roundtable, “Who Gives Most to Charity?,” Philanthropy Roundtable, 2022, https://www.philanthropyroundtable.org/almanac/statistics/who-gives. Some of these discrepancies might be attributable to varied phrasing of survey items that query respondents about the kinds of service or giving in which they have participated. 36 36 As discussed in the preceding paragraphs.
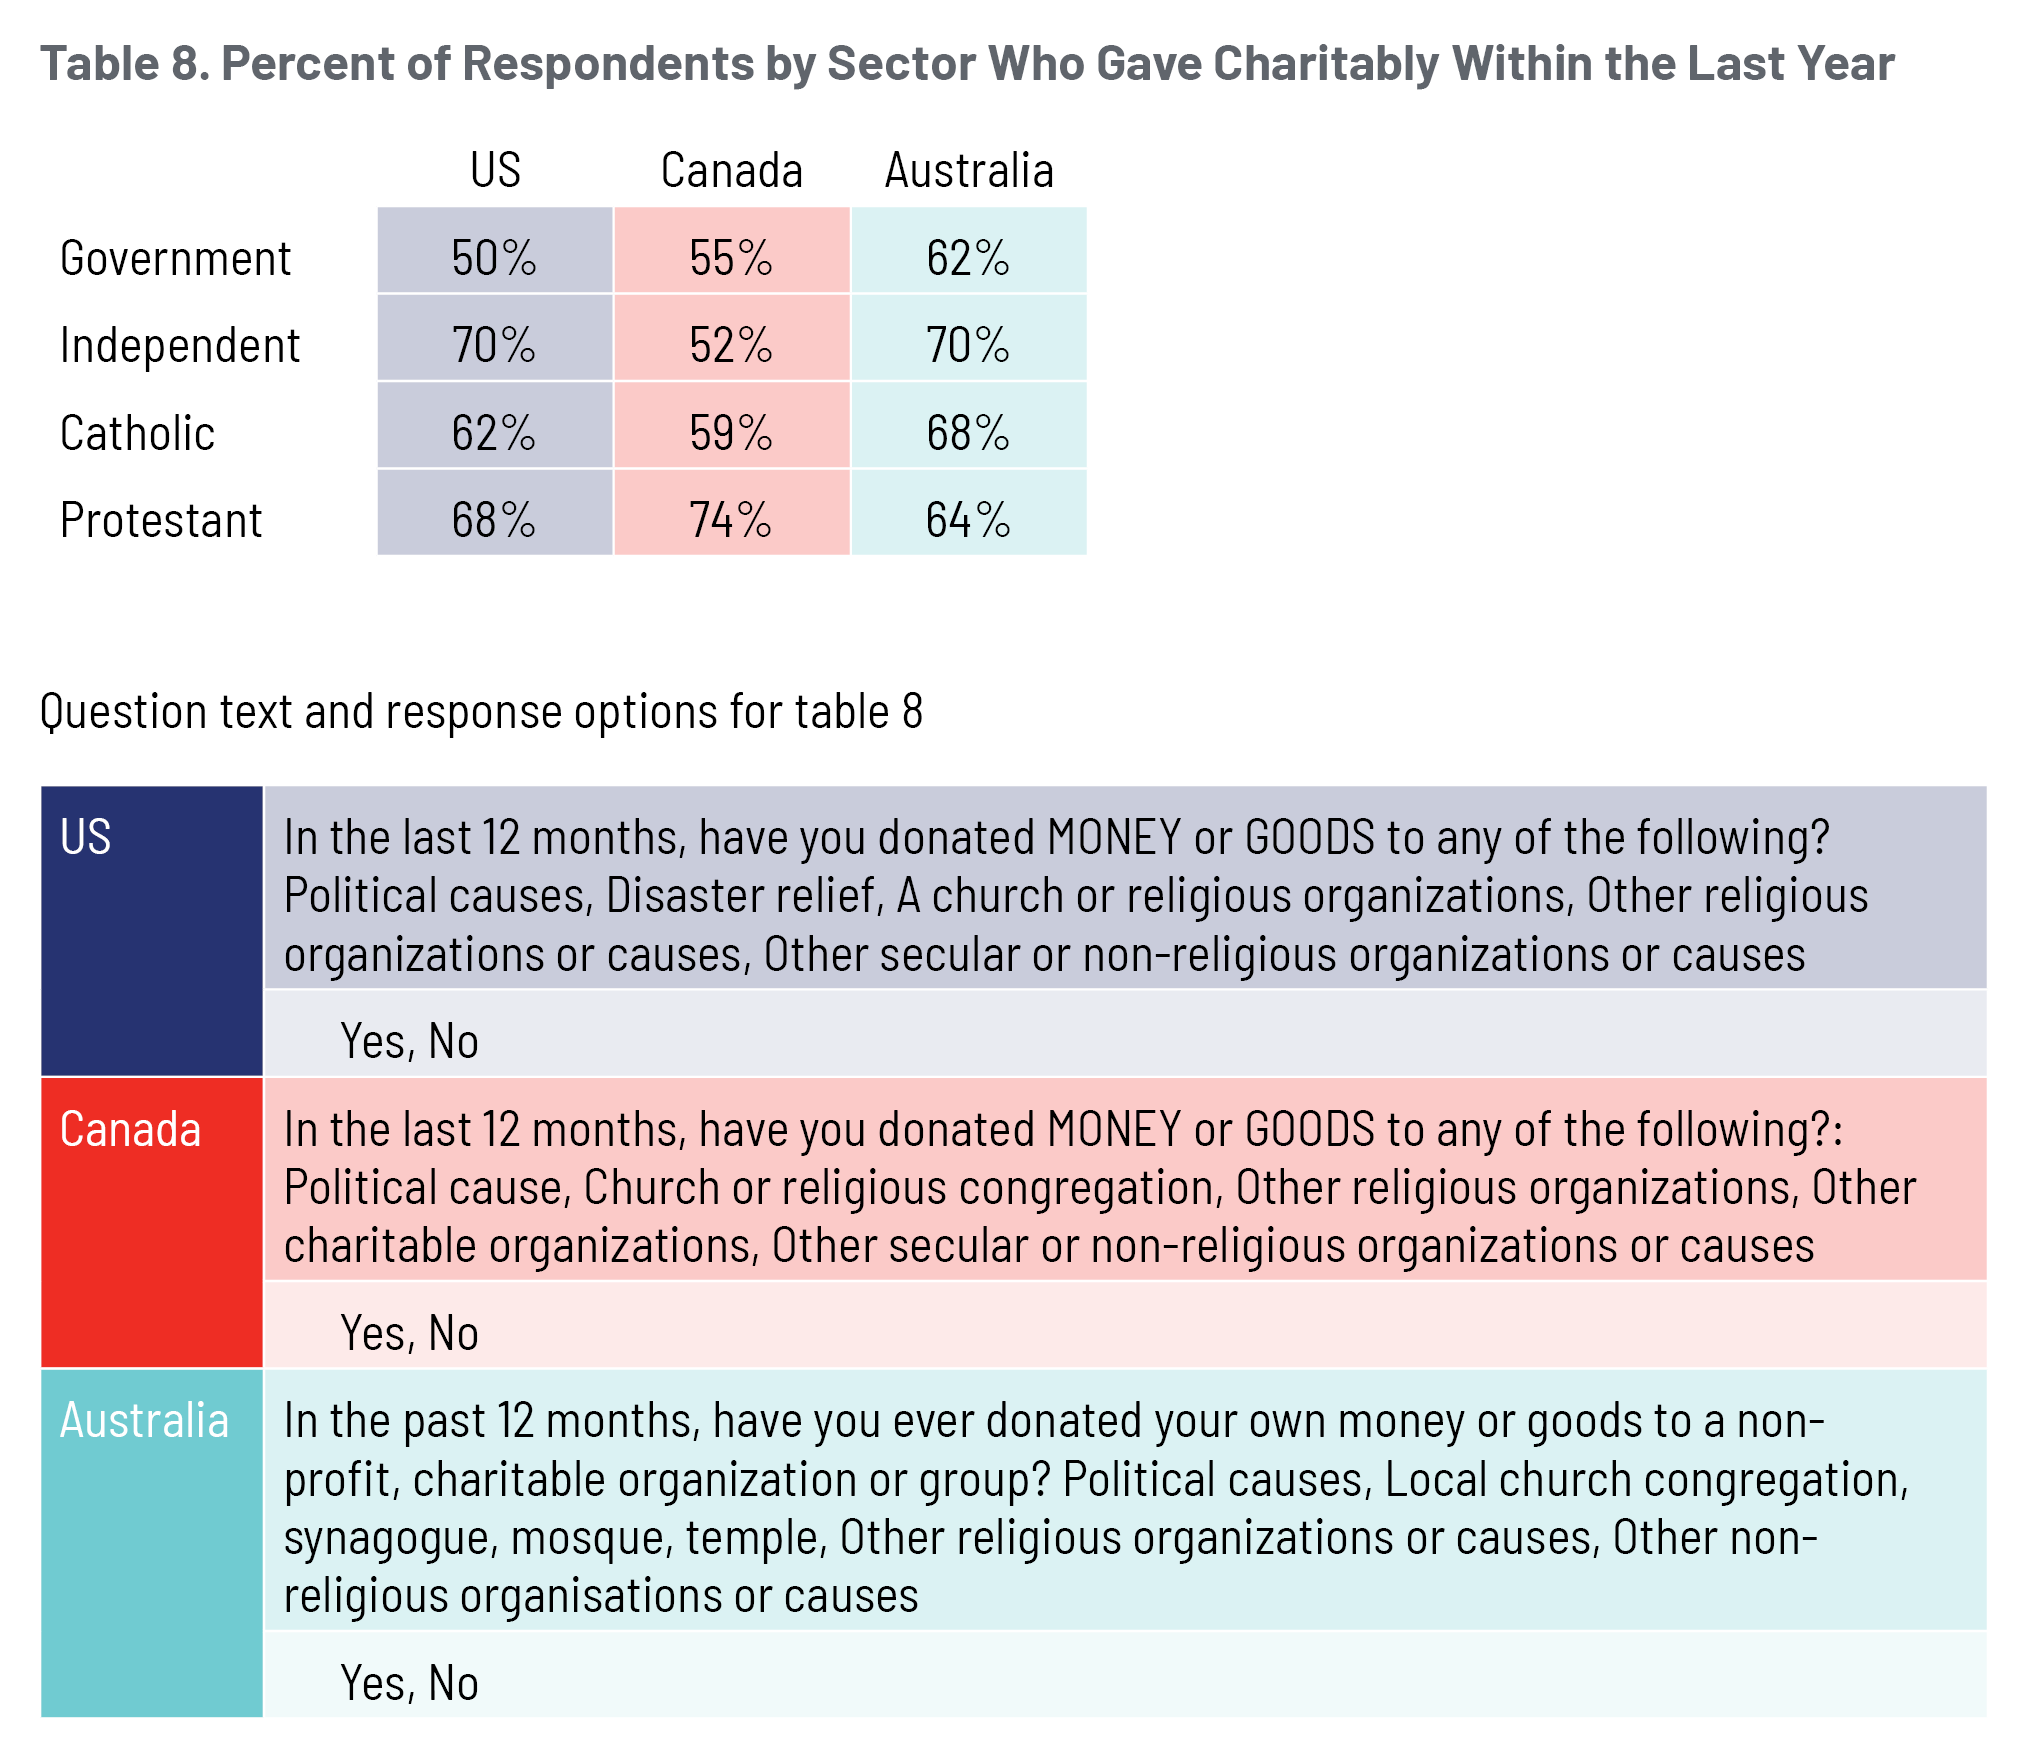
Sector-level patterns in charitable giving differed from country-level patterns across the countries. Among Catholic-school graduates, for example, charitable giving rates are higher among American respondents than Canadian respondents. At 62 percent, the giving rate among graduates from American Catholic schools is 10 percentage points higher than the rate among American respondents overall, while charitable-giving rates for the Canadian Catholic-school graduates and Canadian respondents overall are about the same, just below 60 percent. In other words, giving rates are higher among Canadian than American respondents overall. But the combination of (1) above-average giving rates among US Catholic-school graduates and (2) the small difference between giving rates between the general and Catholic-schooled Canadian population results in a higher giving rate among US Catholic-school graduates relative to Canadian Catholic-school graduates. These results are presented in figure 8.
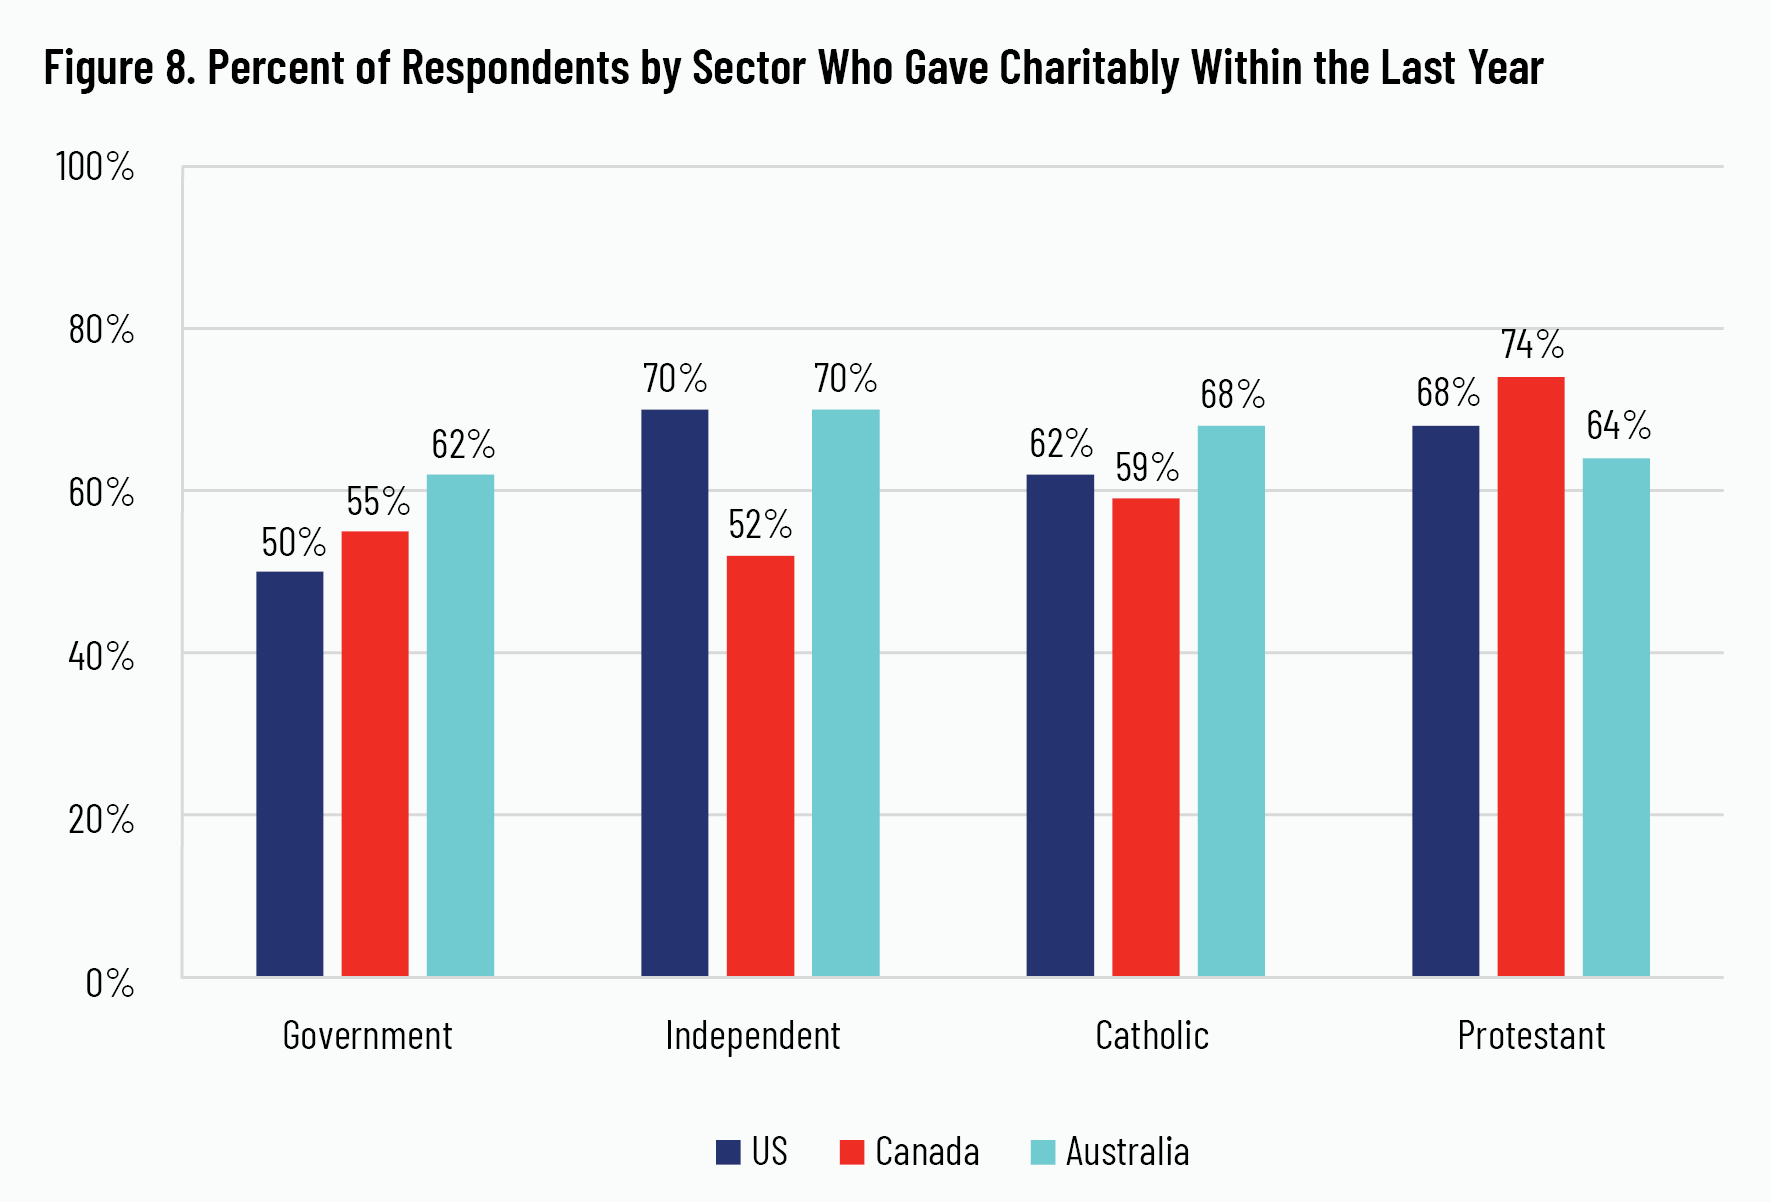
This pattern among Catholic-school graduates is also true among independent-school graduates (see figure 8). There are higher giving rates among graduates from American independent schools compared to the full sample of American respondents and lower giving rates among graduates from Canadian independent schools compared to the full sample of Canadian respondents. These trends may point to why giving rates are higher among American independent-school graduates than among Canadian independent-school graduates, even though giving rates in the overall sample are higher in Canada than in the US.
It appears that graduates from American Catholic and independent schools are influenced in ways that diverge from the general American population, making them more likely to give charitably than not only other American young adults but also most Canadians. Subsequent discussion to explore the reasons behind these findings and other patterns in civic engagement may be worthwhile as all schools consider how to better cultivate the civic virtues and habits that students need for proper citizenship.
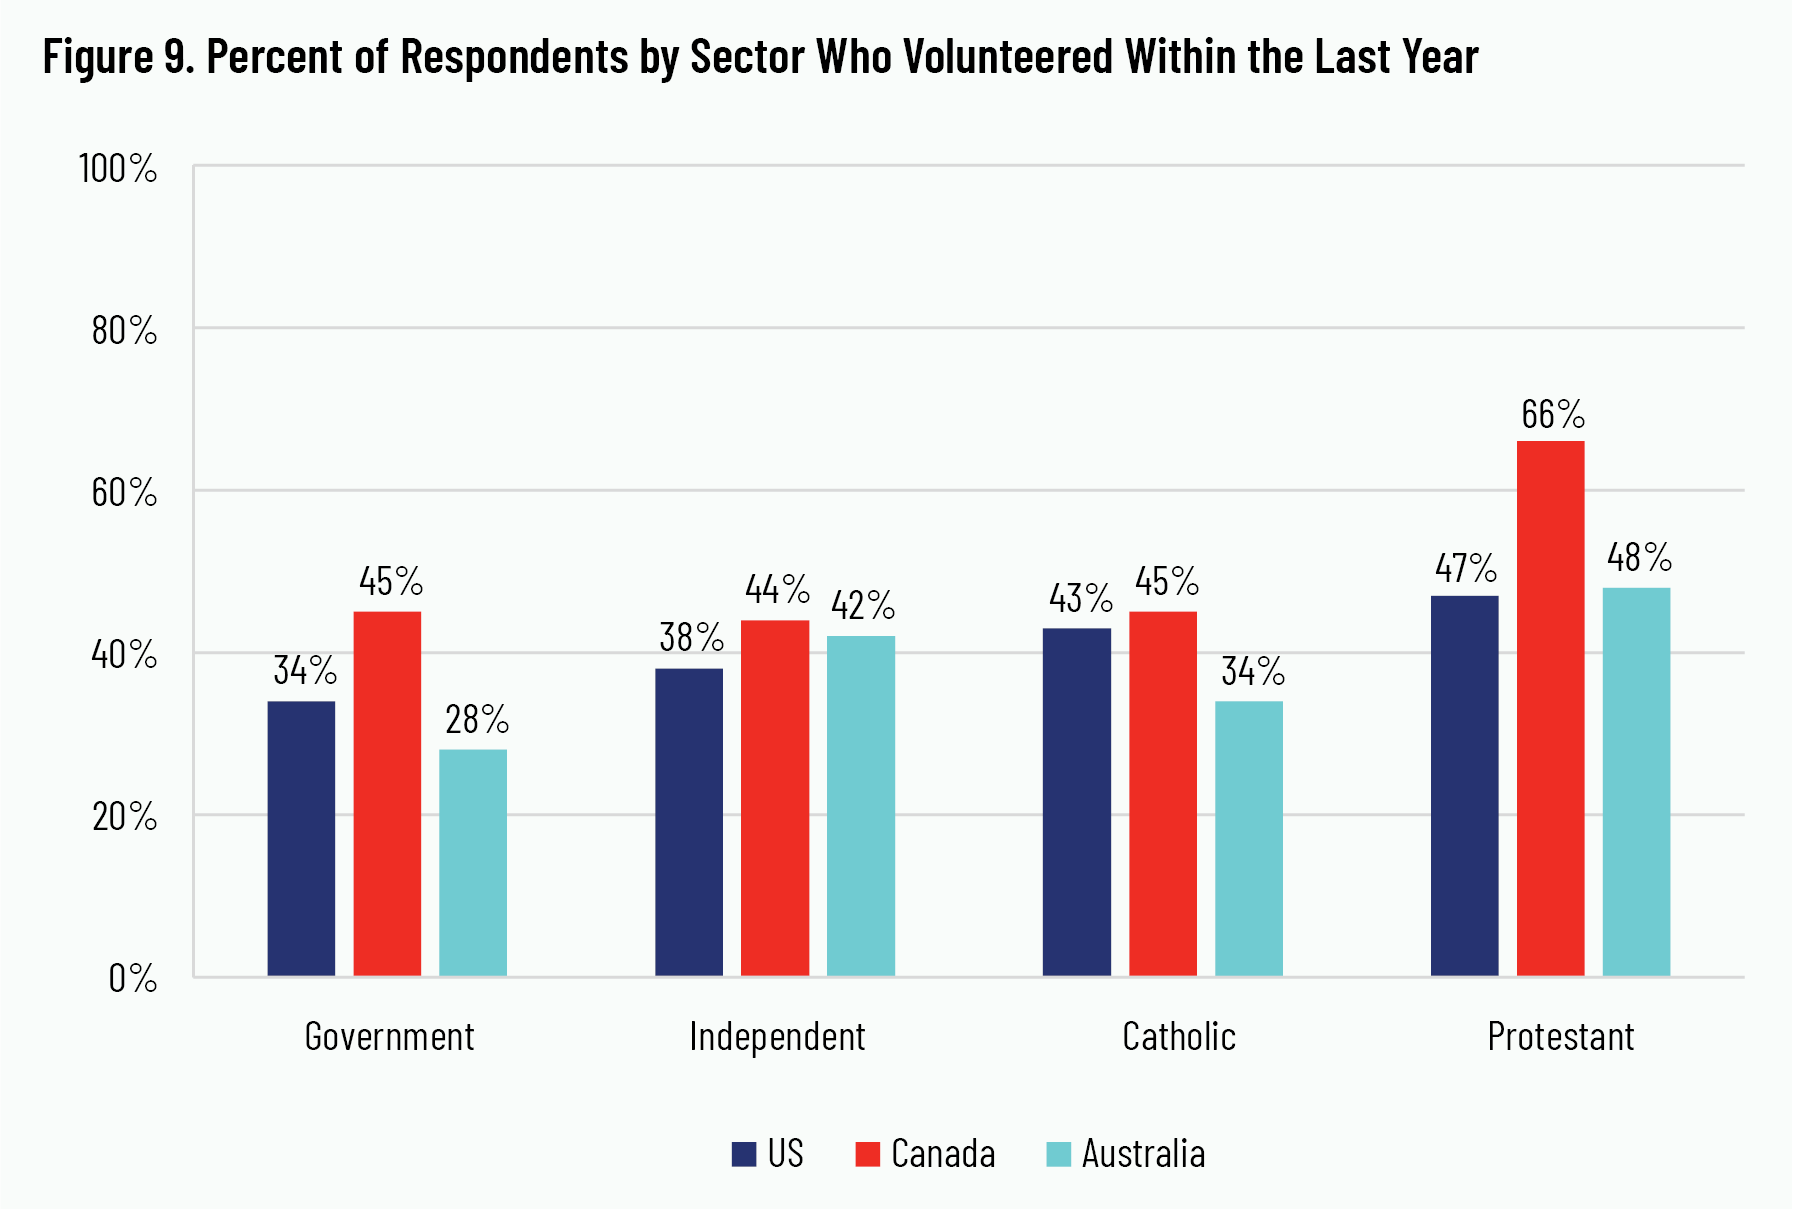
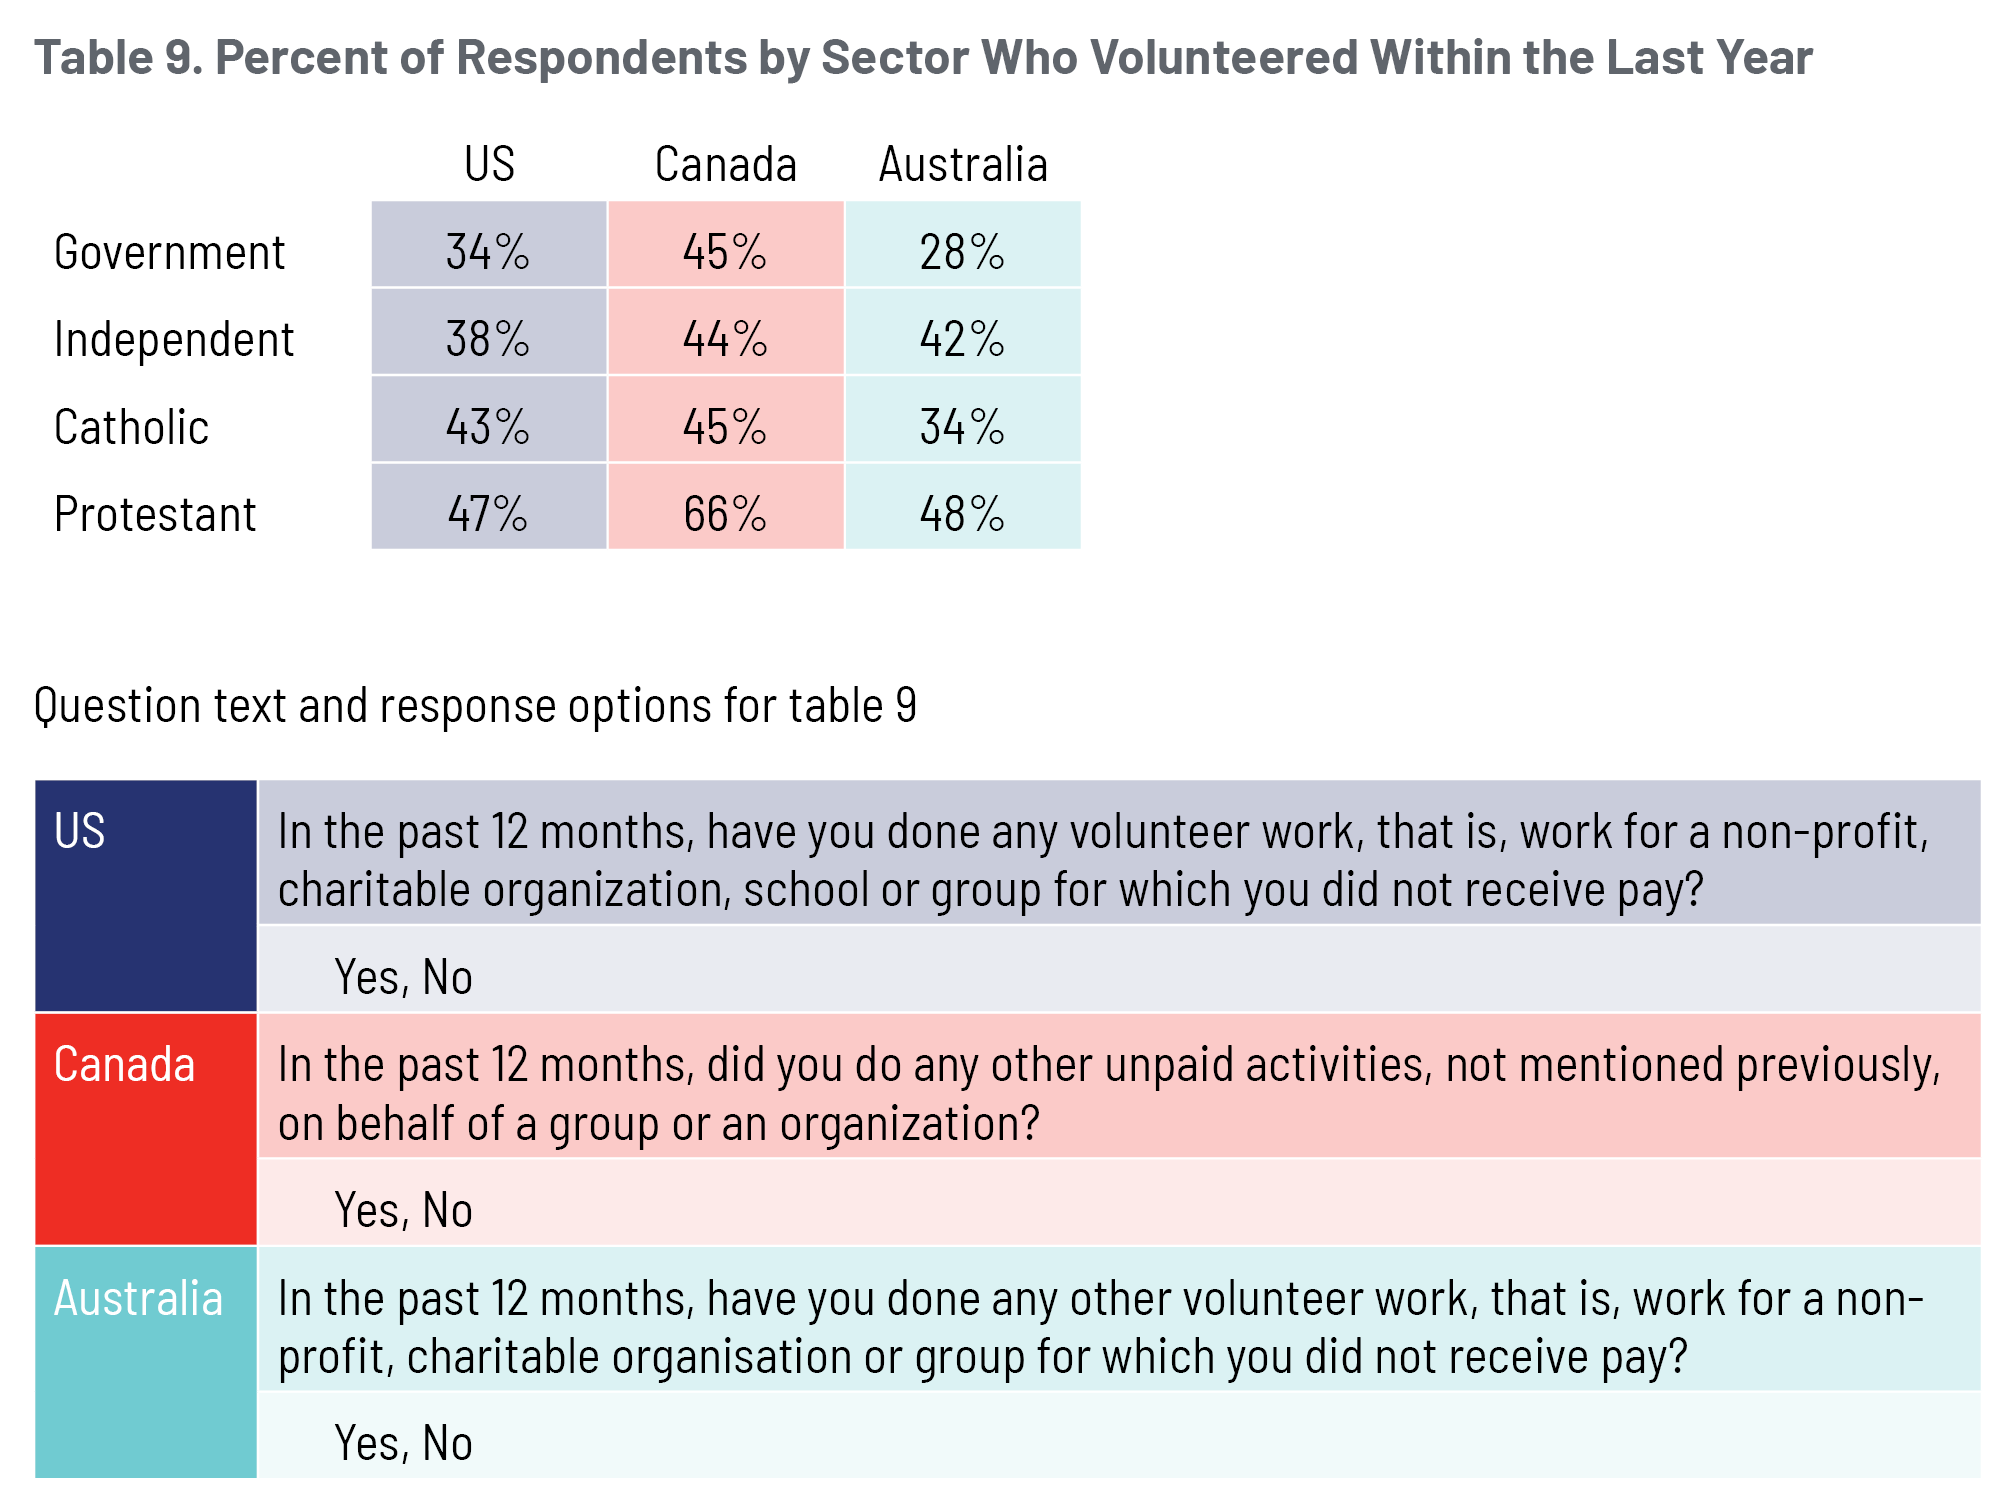
In figure 9, we separately consider volunteering rates for each school sector. We observe Canadian graduates consistently volunteering at higher rates compared to Australian and American graduates. These results are consistent with the results for the countries as a whole, shown in figure 7. More striking, meanwhile, is the distinction in the volunteering rate among Canadian Protestant-school graduates relative to the rates among Australian and American Protestant-school graduates. Two-thirds of Canadian Protestant-school graduates report volunteering in the past twelve months, compared to less than half of Australian and American Protestant graduates. Again, some of the differences between Canada and the other two countries may be attributable to the slightly different approach to querying respondents about their volunteering.
3. Family Formation
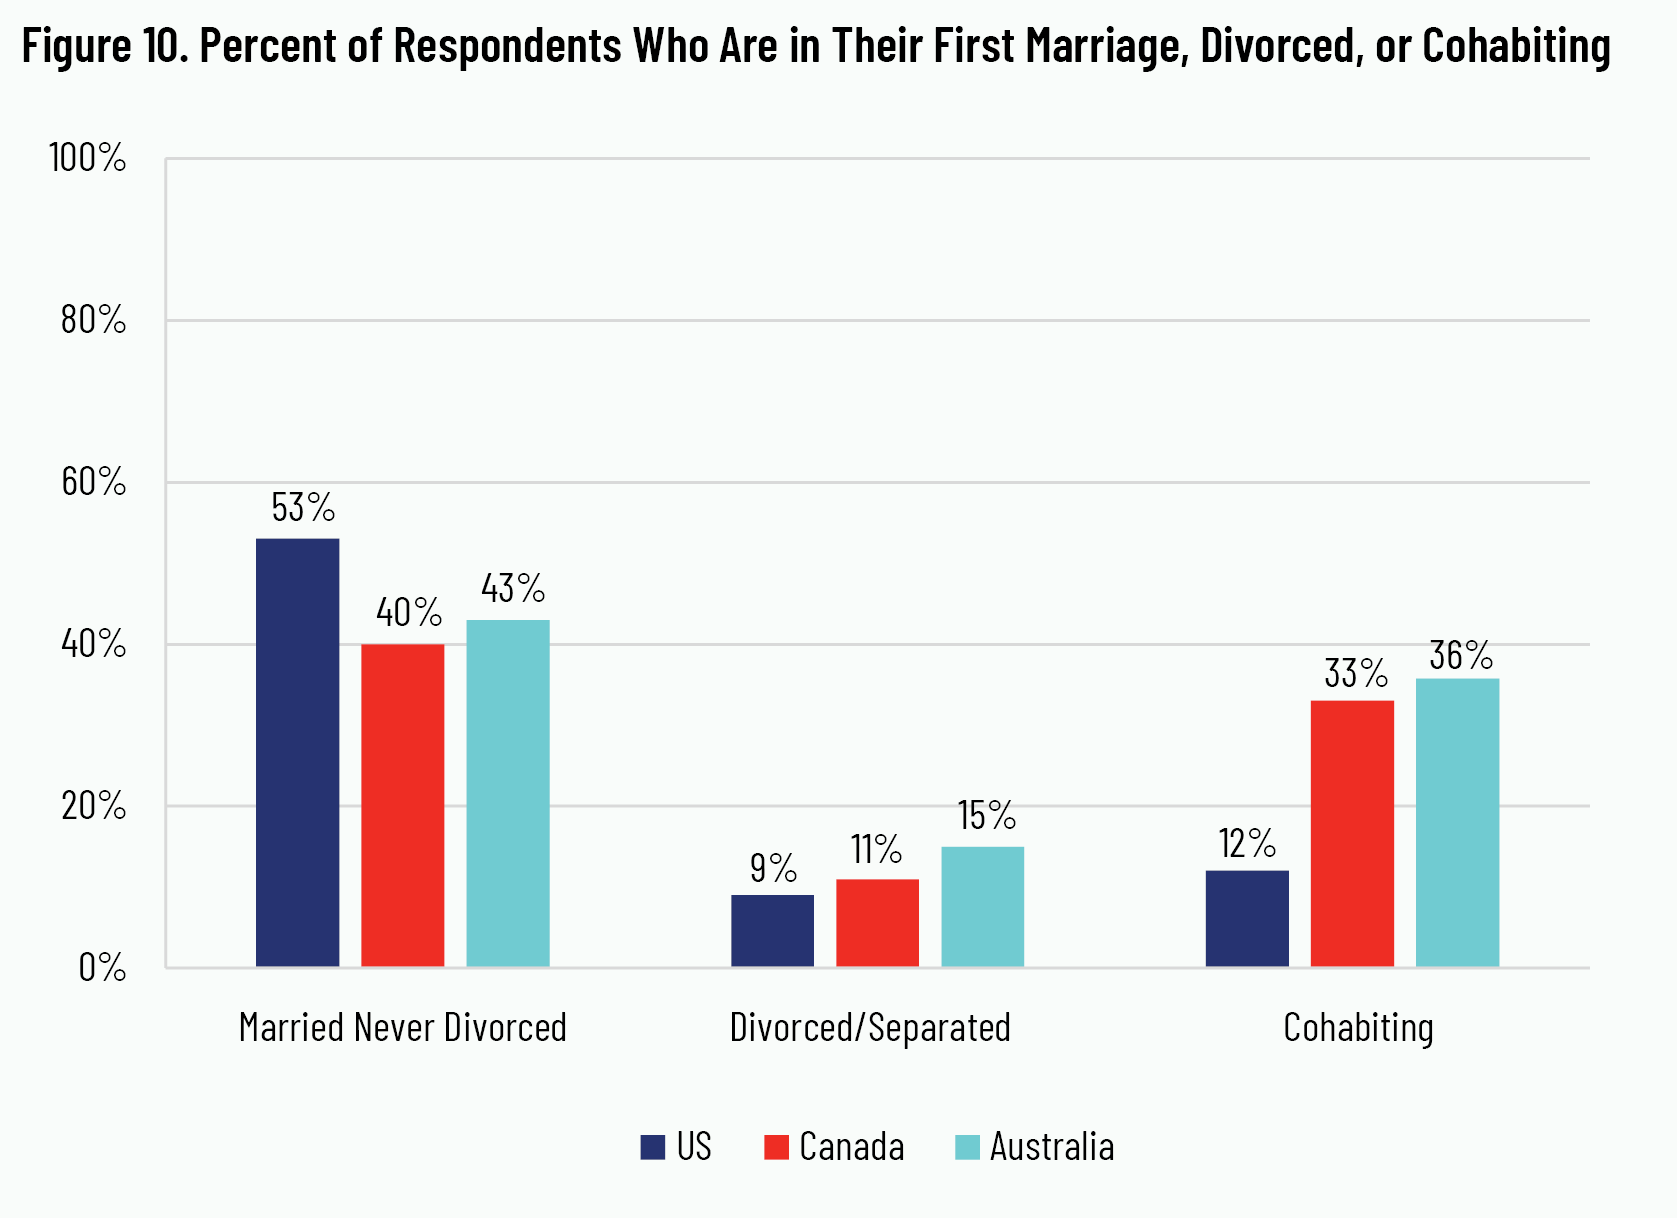
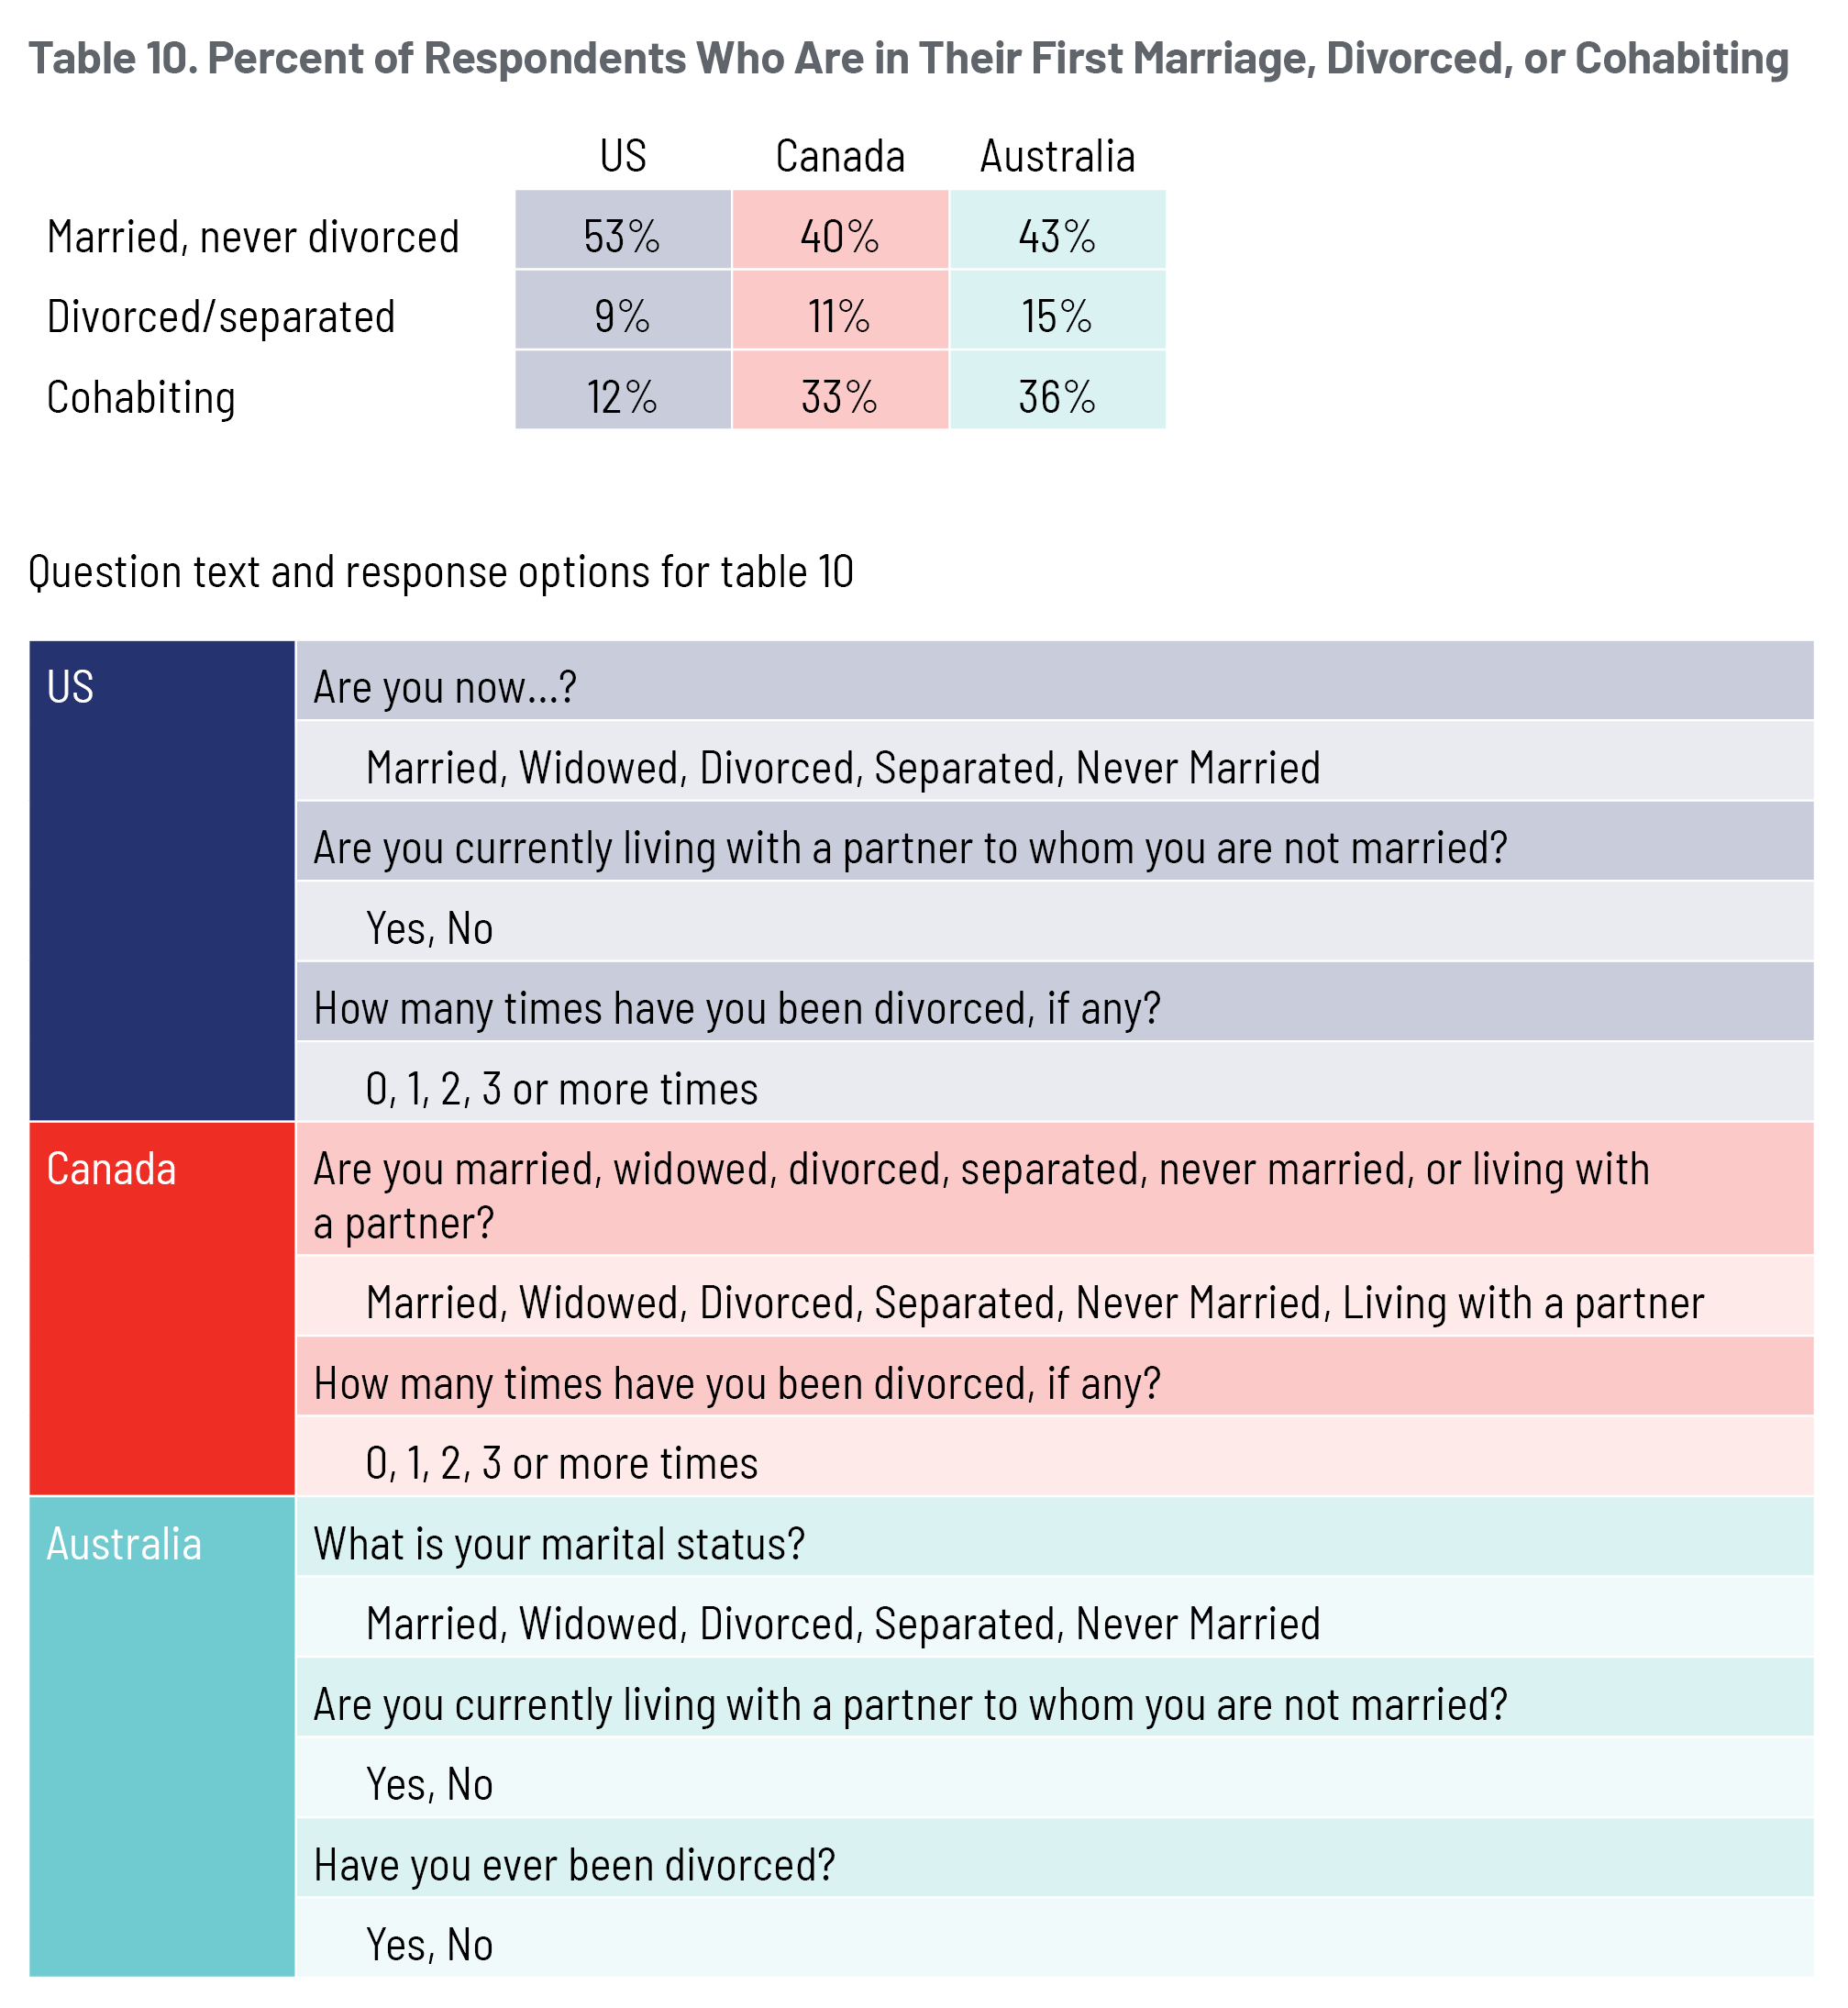
Over the past several decades a smaller percentage of the population in many countries throughout the world are marrying. 37 37 E. Ortiz-Ospina and M. Roser, “Marriages and Divorces,” Our World in Data, 2020, https://ourworldindata.org/marriages-and-divorces. The US, Canada, and Australia are no exceptions to this larger trend. When we consider marriage—with the added condition of never having divorced—in our data, we observe the highest rates in the US, where 53 percent of twenty-four- to thirty-nine-year-old respondents are married and have never divorced. Taking a closer look at these numbers in figure 10, marriage and never-divorced rates are thirteen and ten percentage points lower for the same age demographic in Canada and Australia, respectively. In contrast, the proportion of respondents who have been divorced or are cohabiting is highest in Australia and lowest in the US. About 15 percent of Australian respondents report ever being divorced compared to 9 percent of American respondents. Cohabitation rates among American respondents are almost three times lower than the one-third of Canadian and Australian respondents who are currently cohabiting.
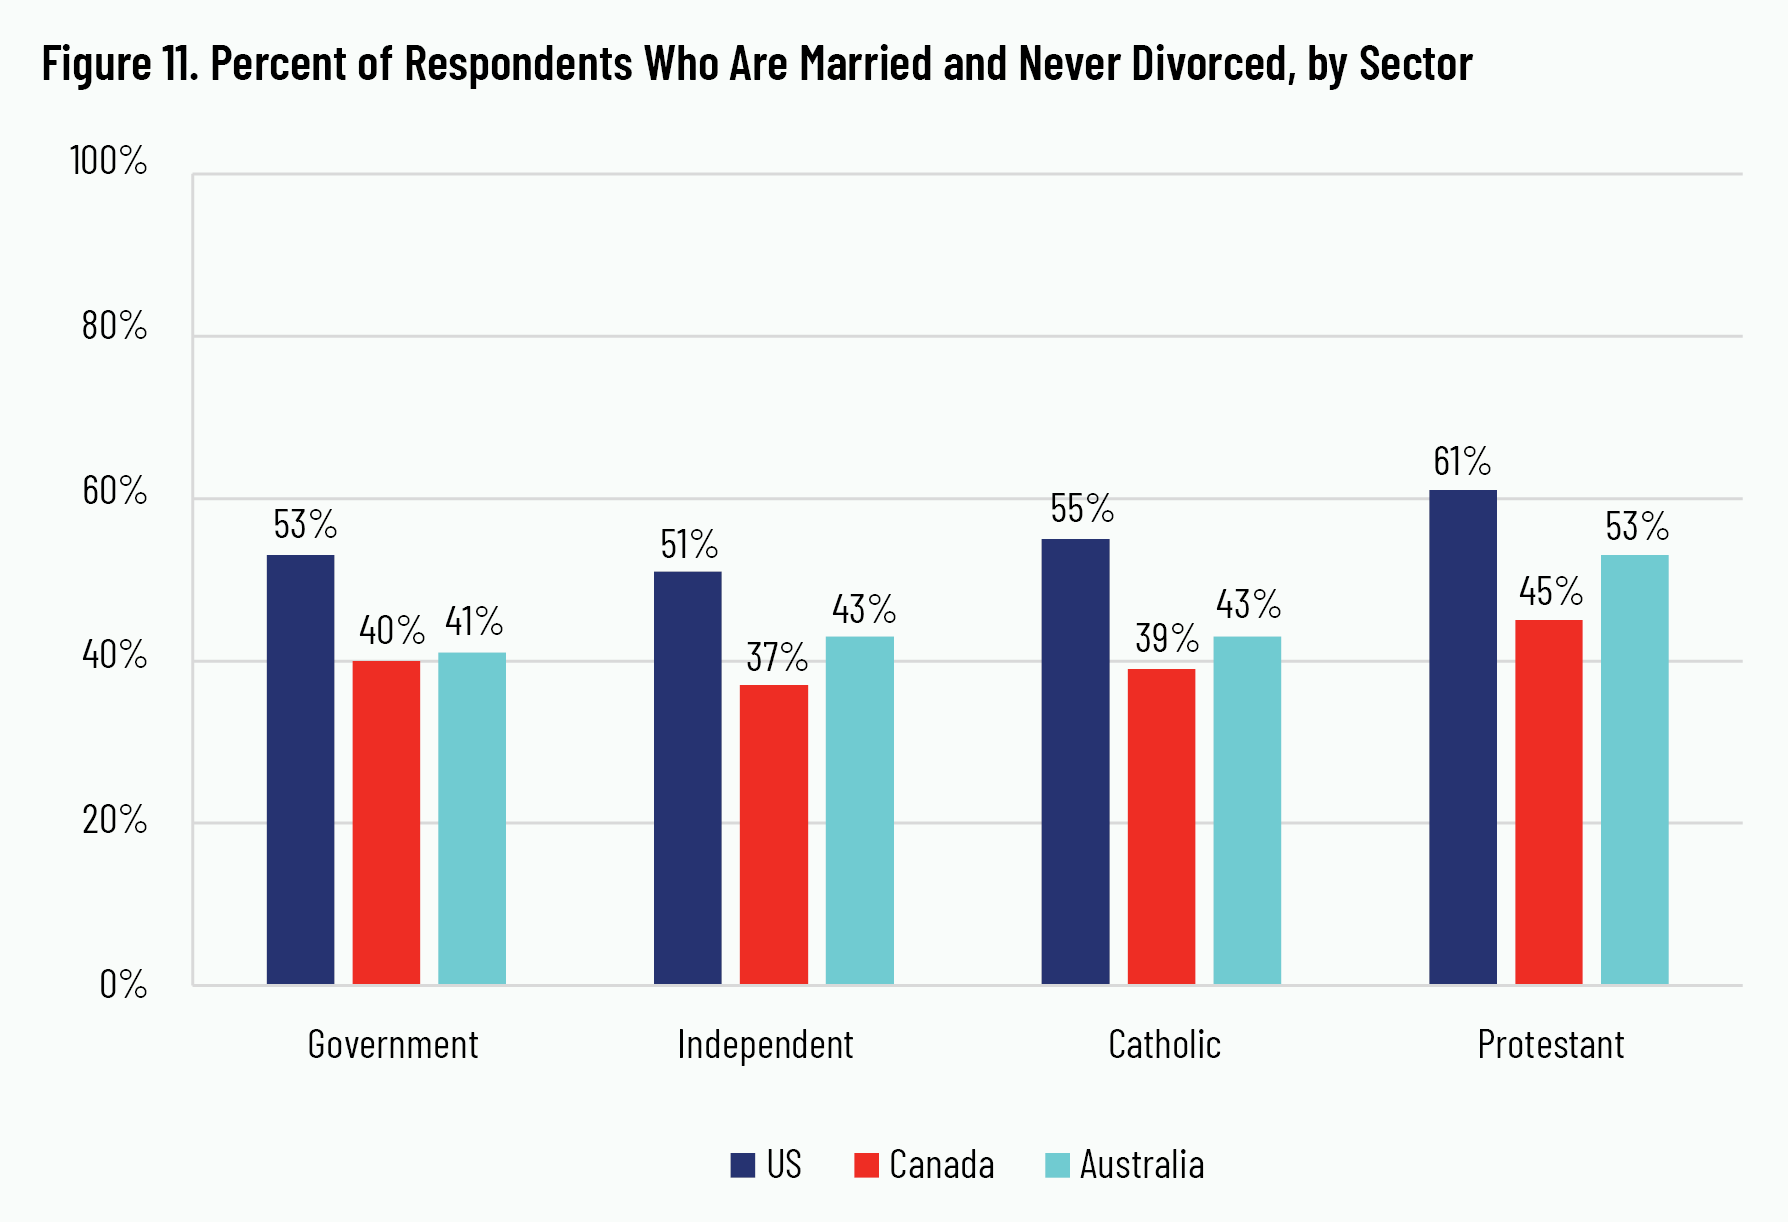
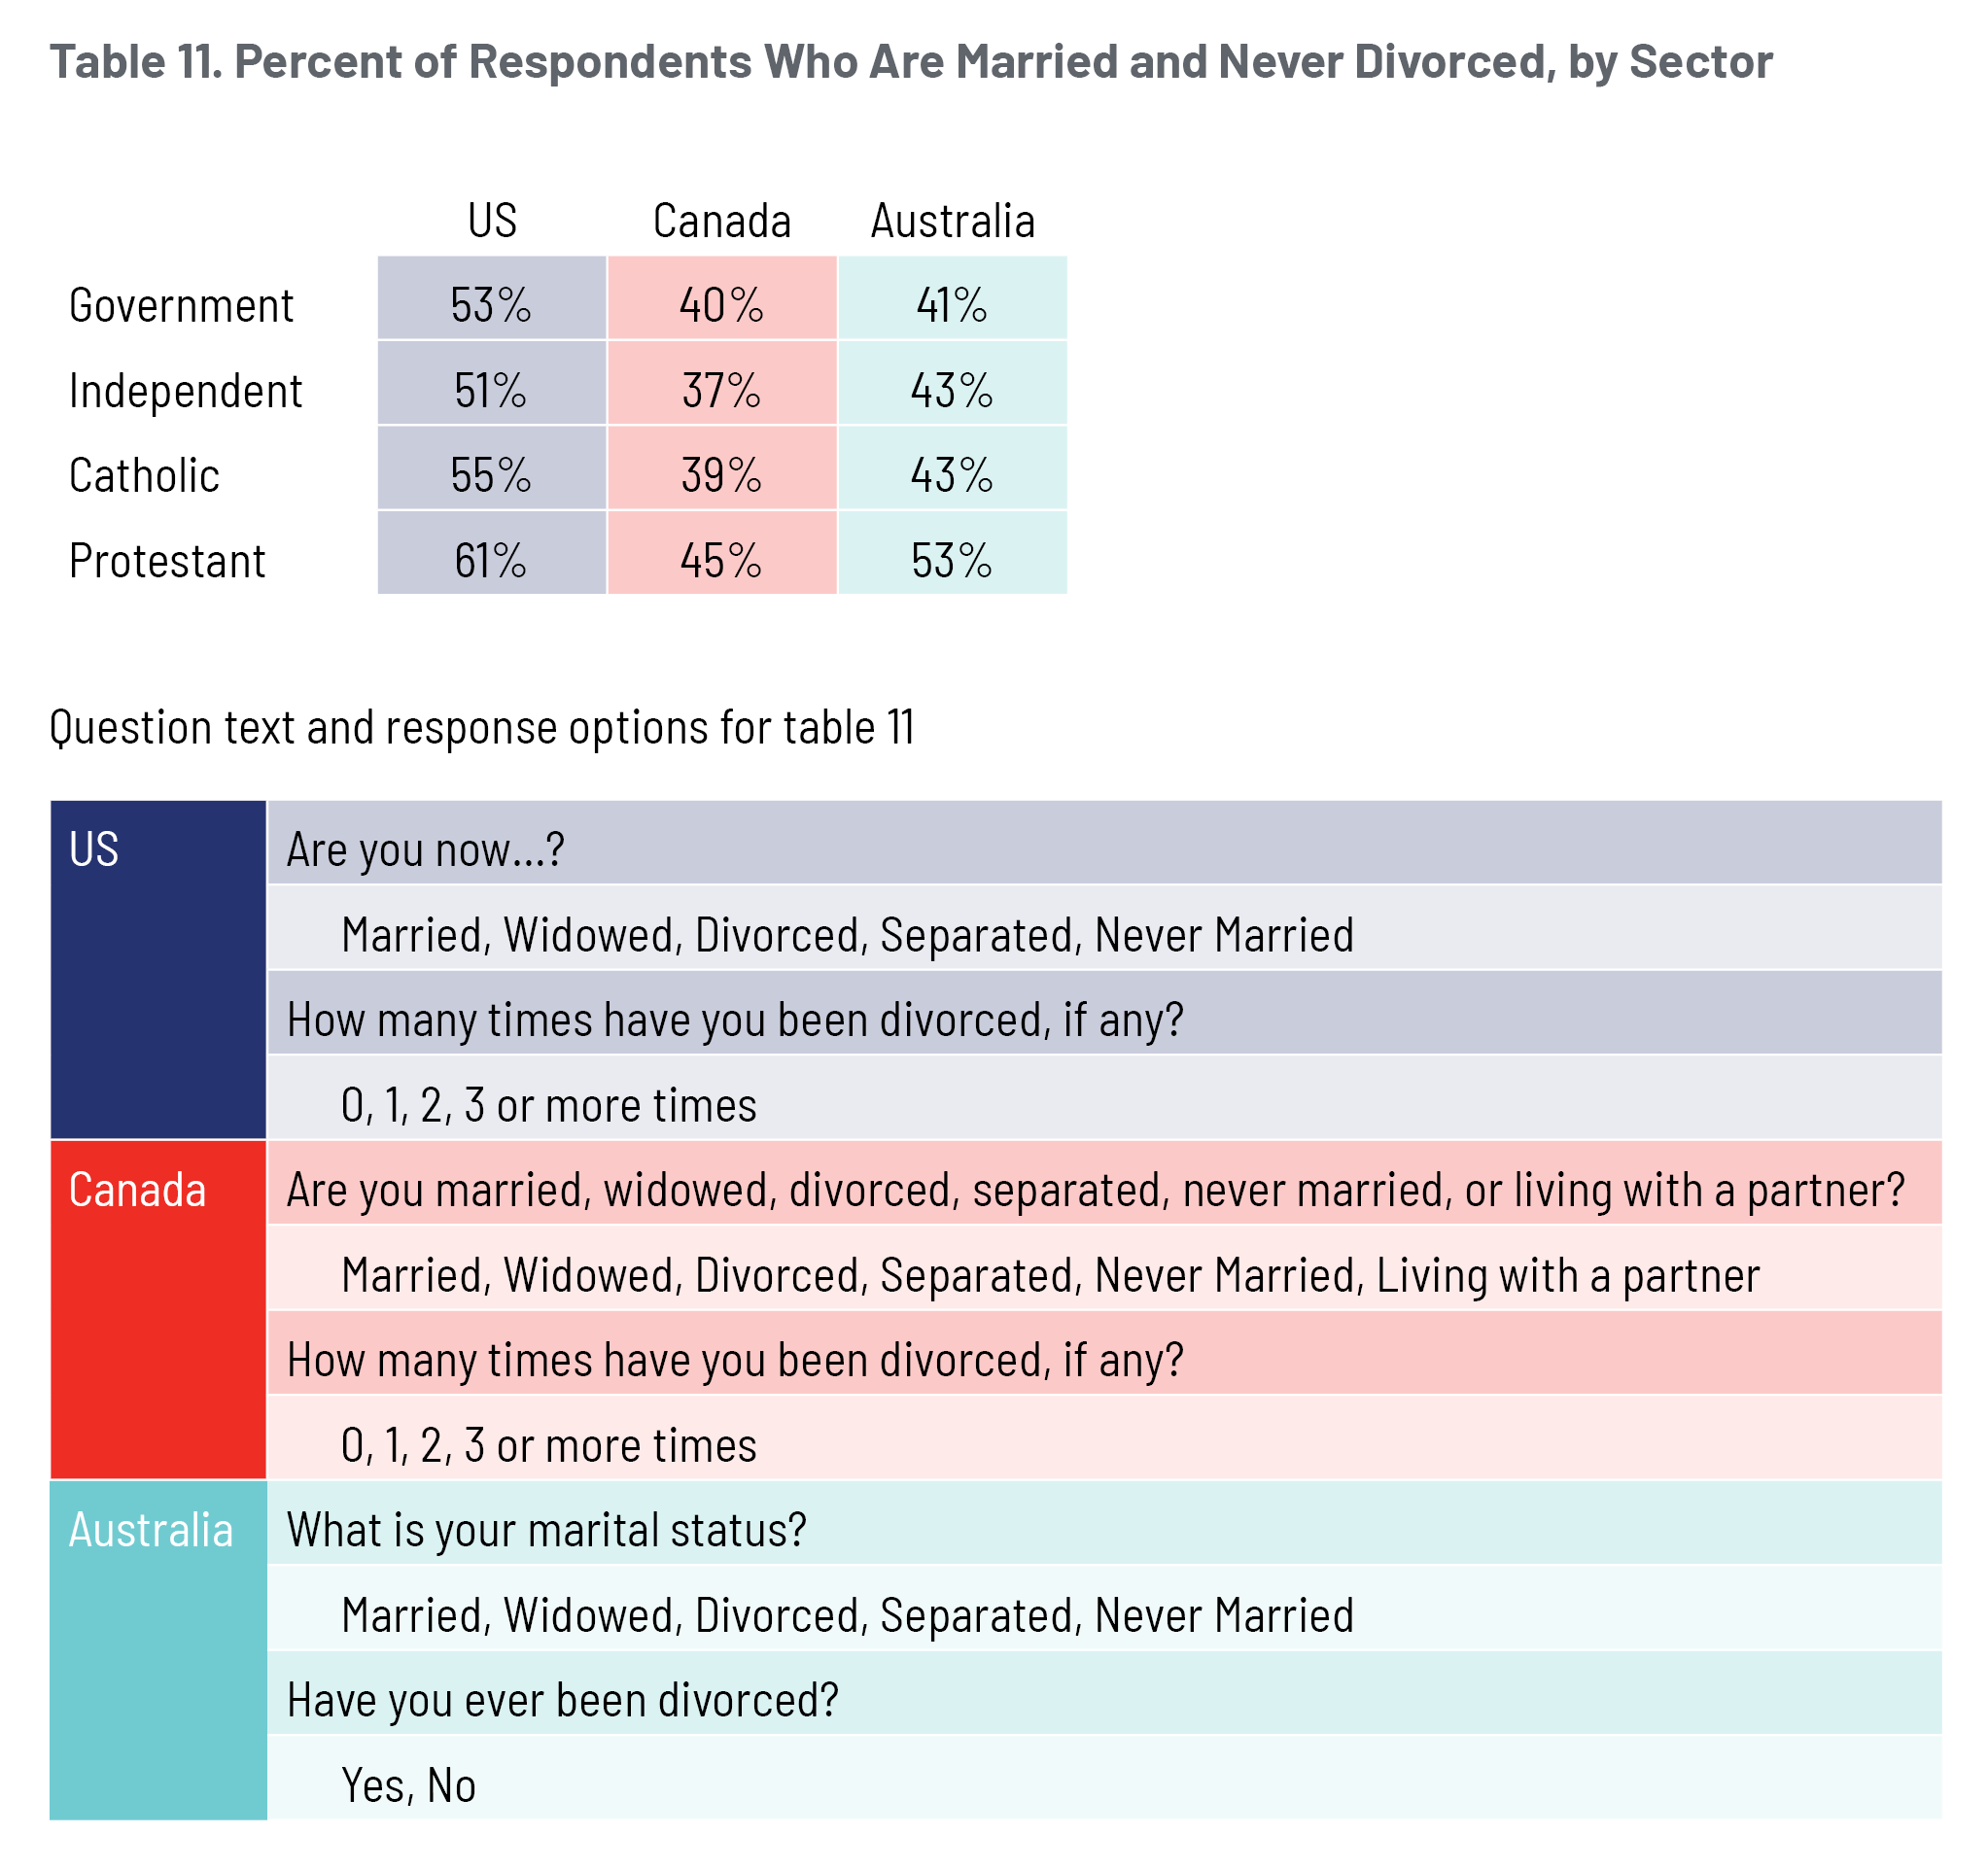
These trends are consistent within specific school sectors too, though the magnitude of the differences vary. For instance, as shown in figure 11, 61 percent of American Protestant-school graduates are in their first marriage, the highest among all three countries. Marriage rates among Canadian and Australian Protestant-school graduates are higher than average within their respective countries, but the gaps relative to American Protestant-school graduates remain about the same as those we observed for the full sample within each country.
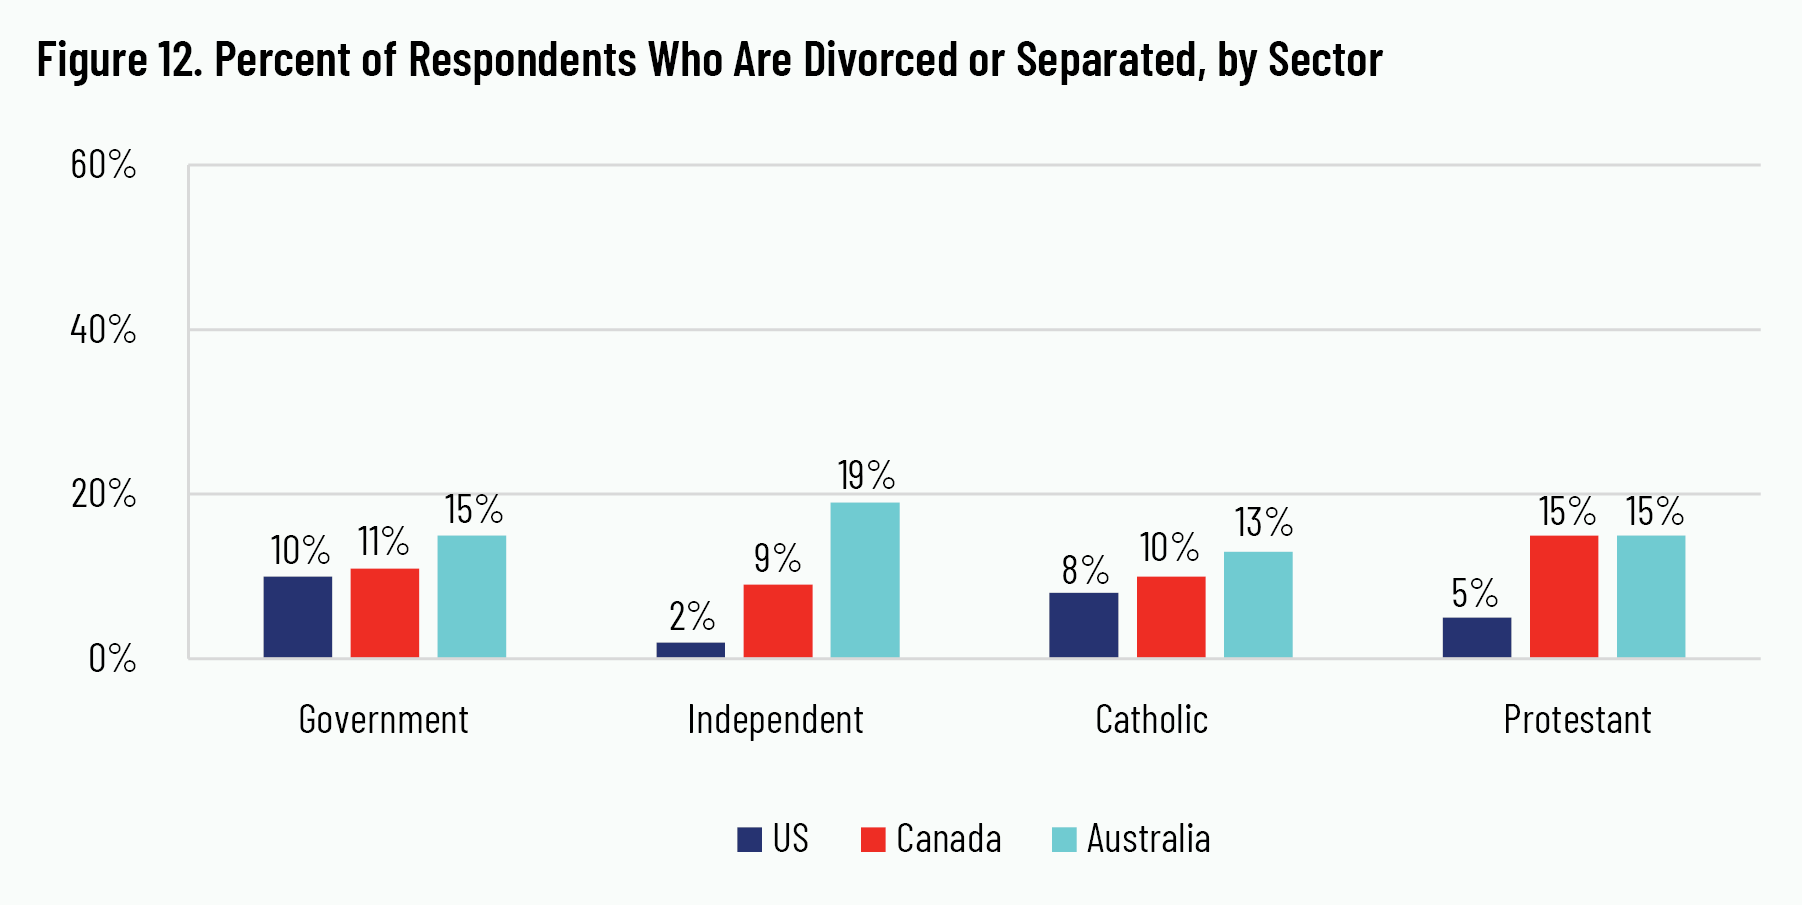
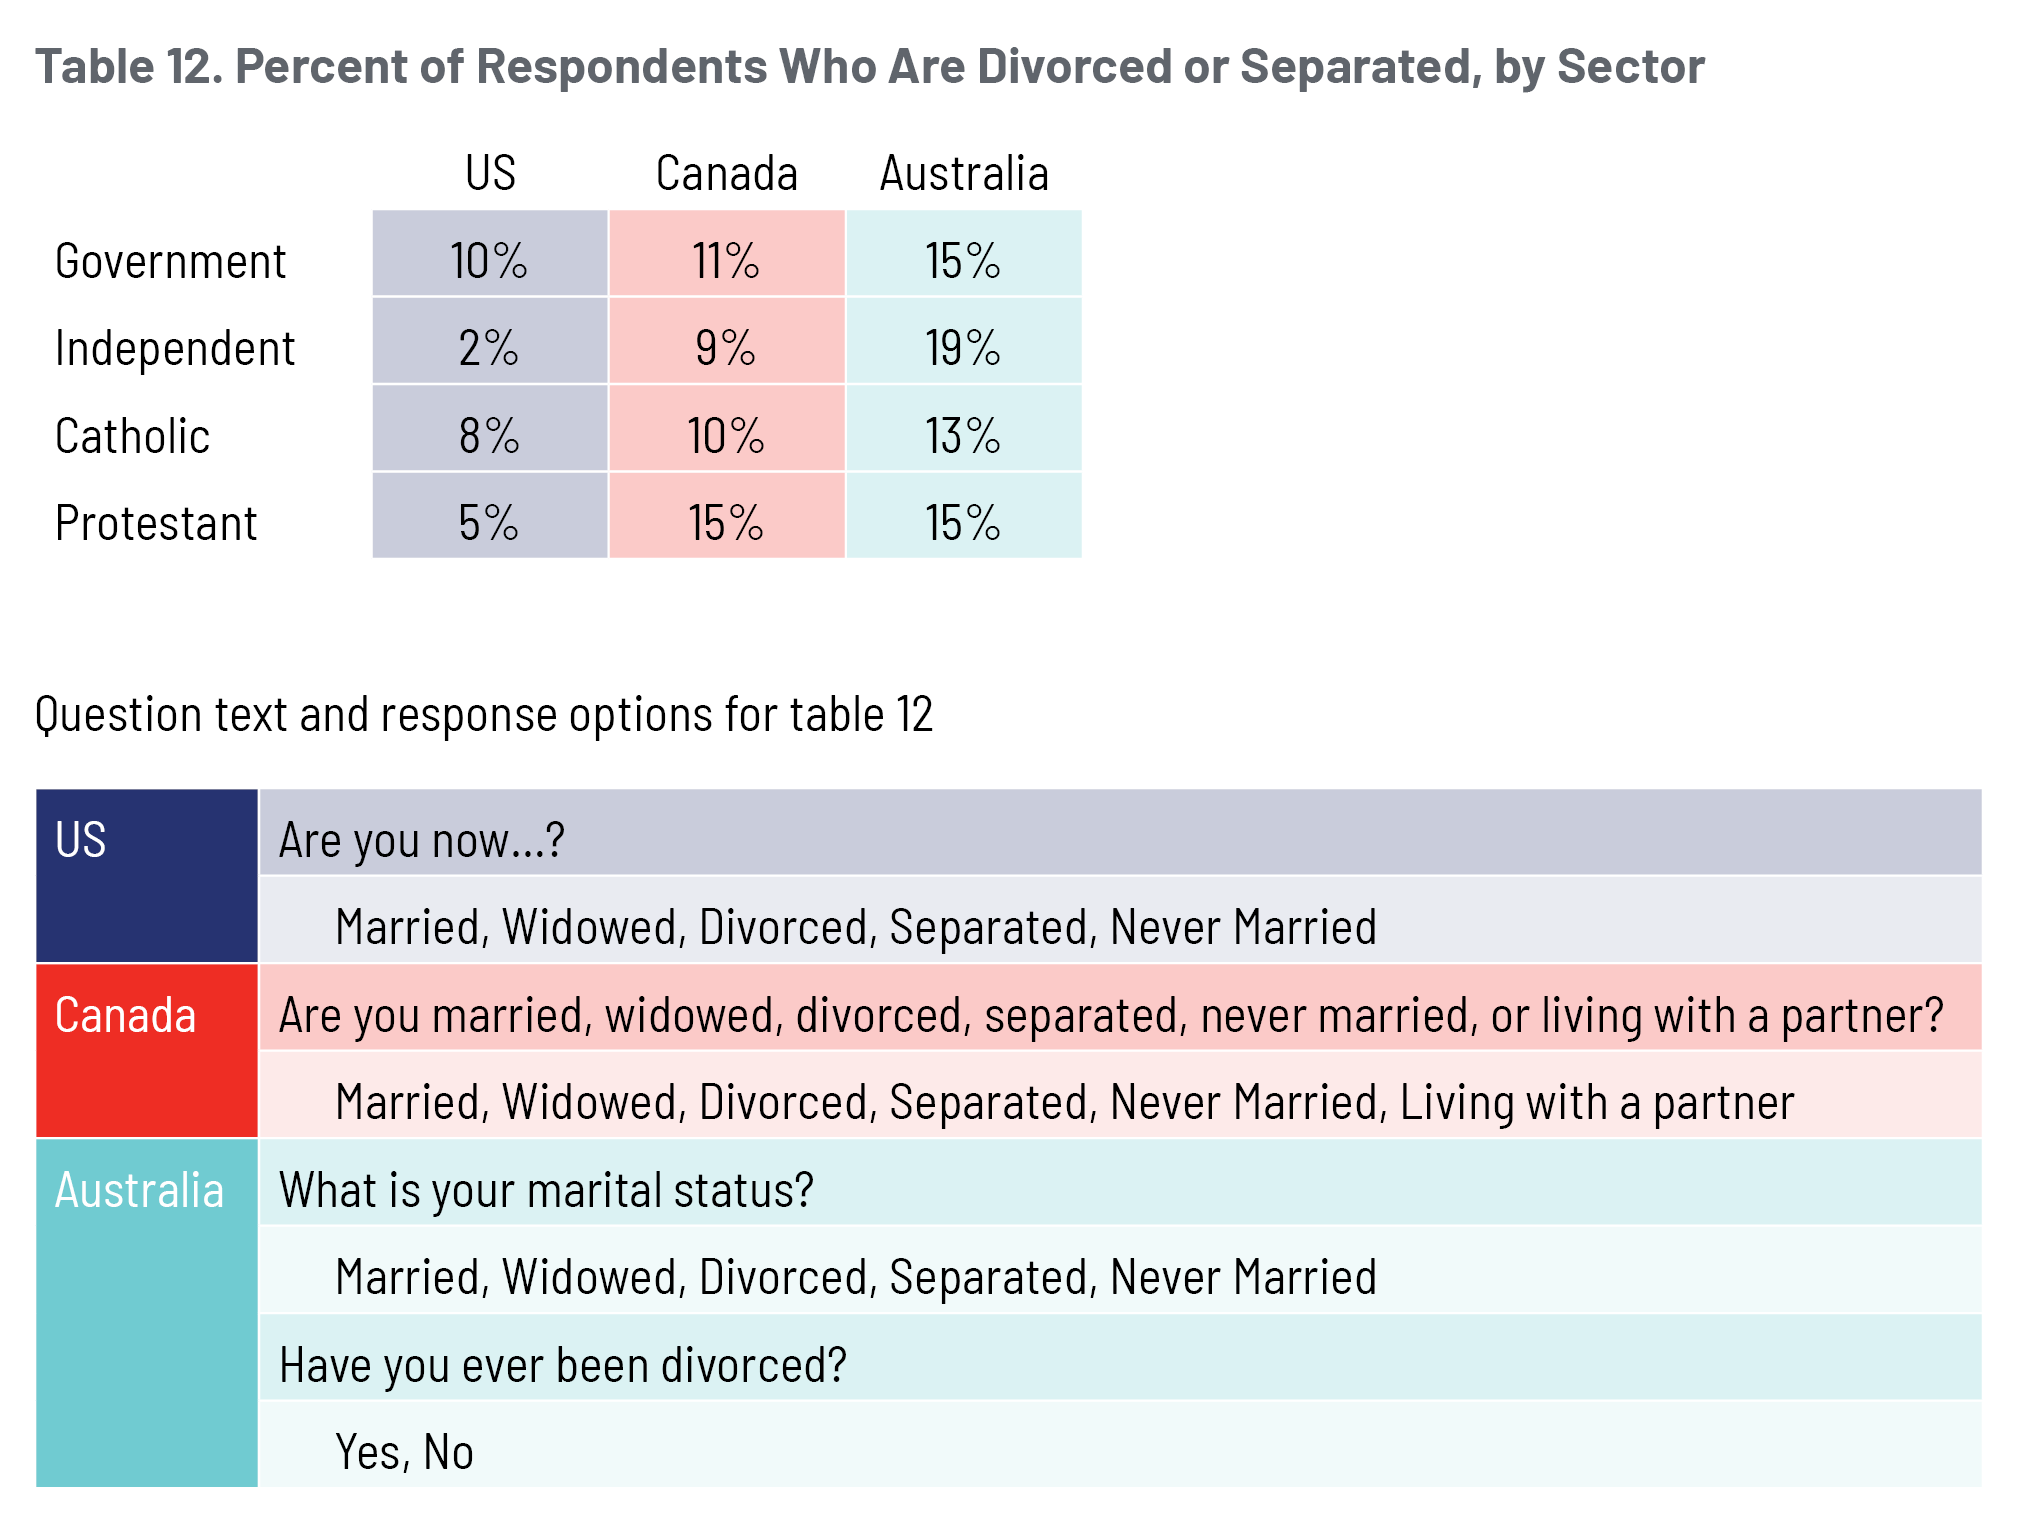
Meanwhile, as shown in figure 12, the number of divorced or separated respondents is as high as 19 percent for Australian independent-school graduates, compared to only 2 percent for American independent-school graduates.
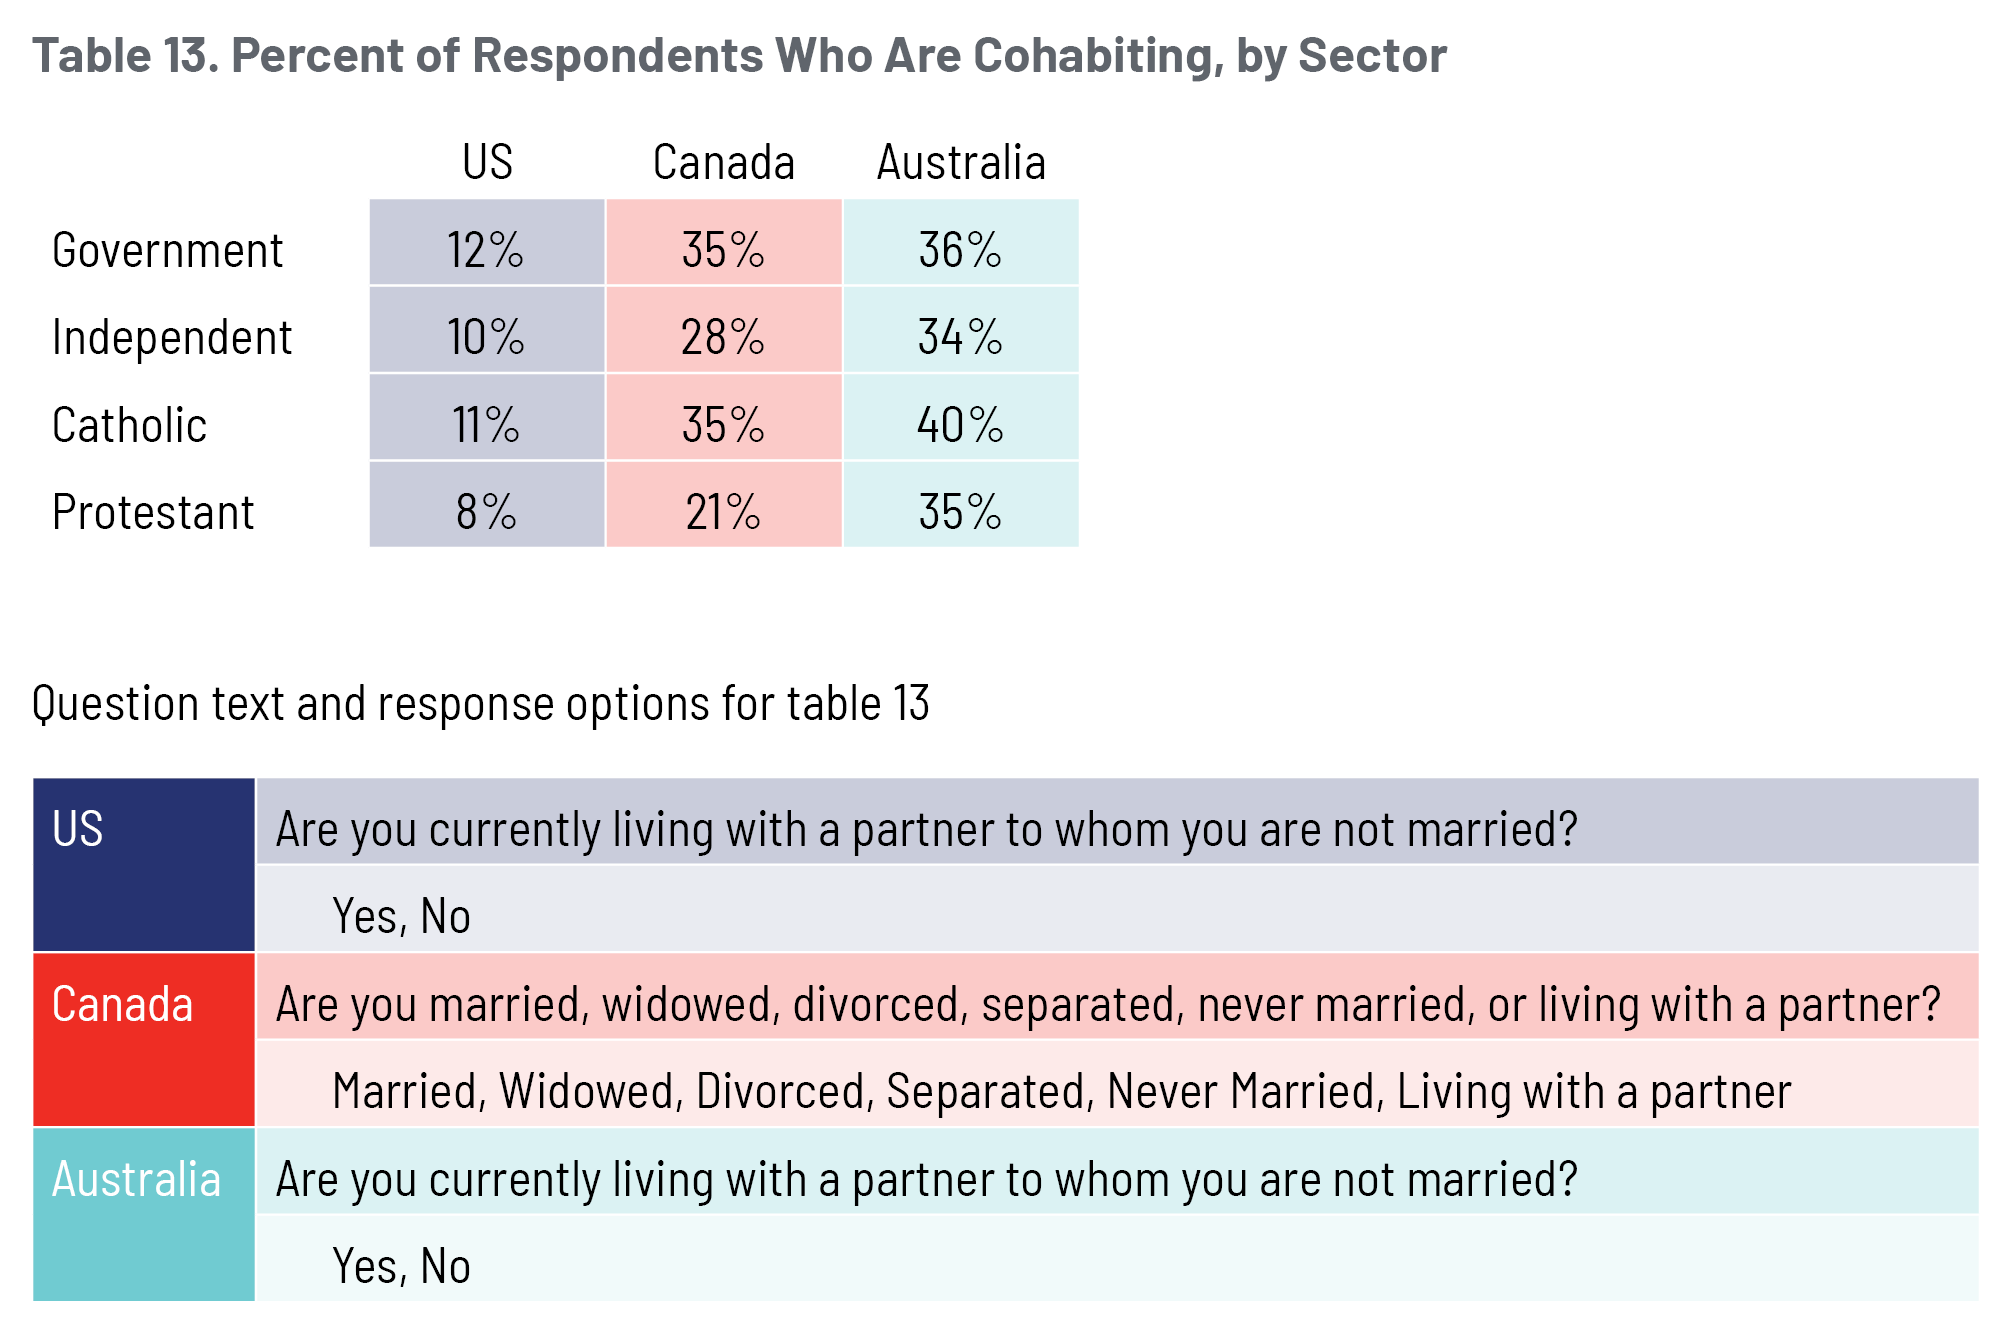
Similar to divorce rates, cohabitation rates are generally higher among Australian and Canadian graduates compared to American graduates in all school sectors (see figure 13). Across the four sectors, over one-third of Australian graduates are living with an unmarried partner. Over one-third of graduates from Canadian Catholic and government schools live with their unmarried partner—a rate similar to graduates from Australian schools in these sectors. In contrast, Canadian Protestant-school graduates are least likely among all Canadian graduates to cohabit; one out of every five of them do so. Finally, cohabitation rates are lowest in the US, ranging from 8 percent of American Protestant-school graduates to a high of 40 percent among Australian Catholic-school graduates.
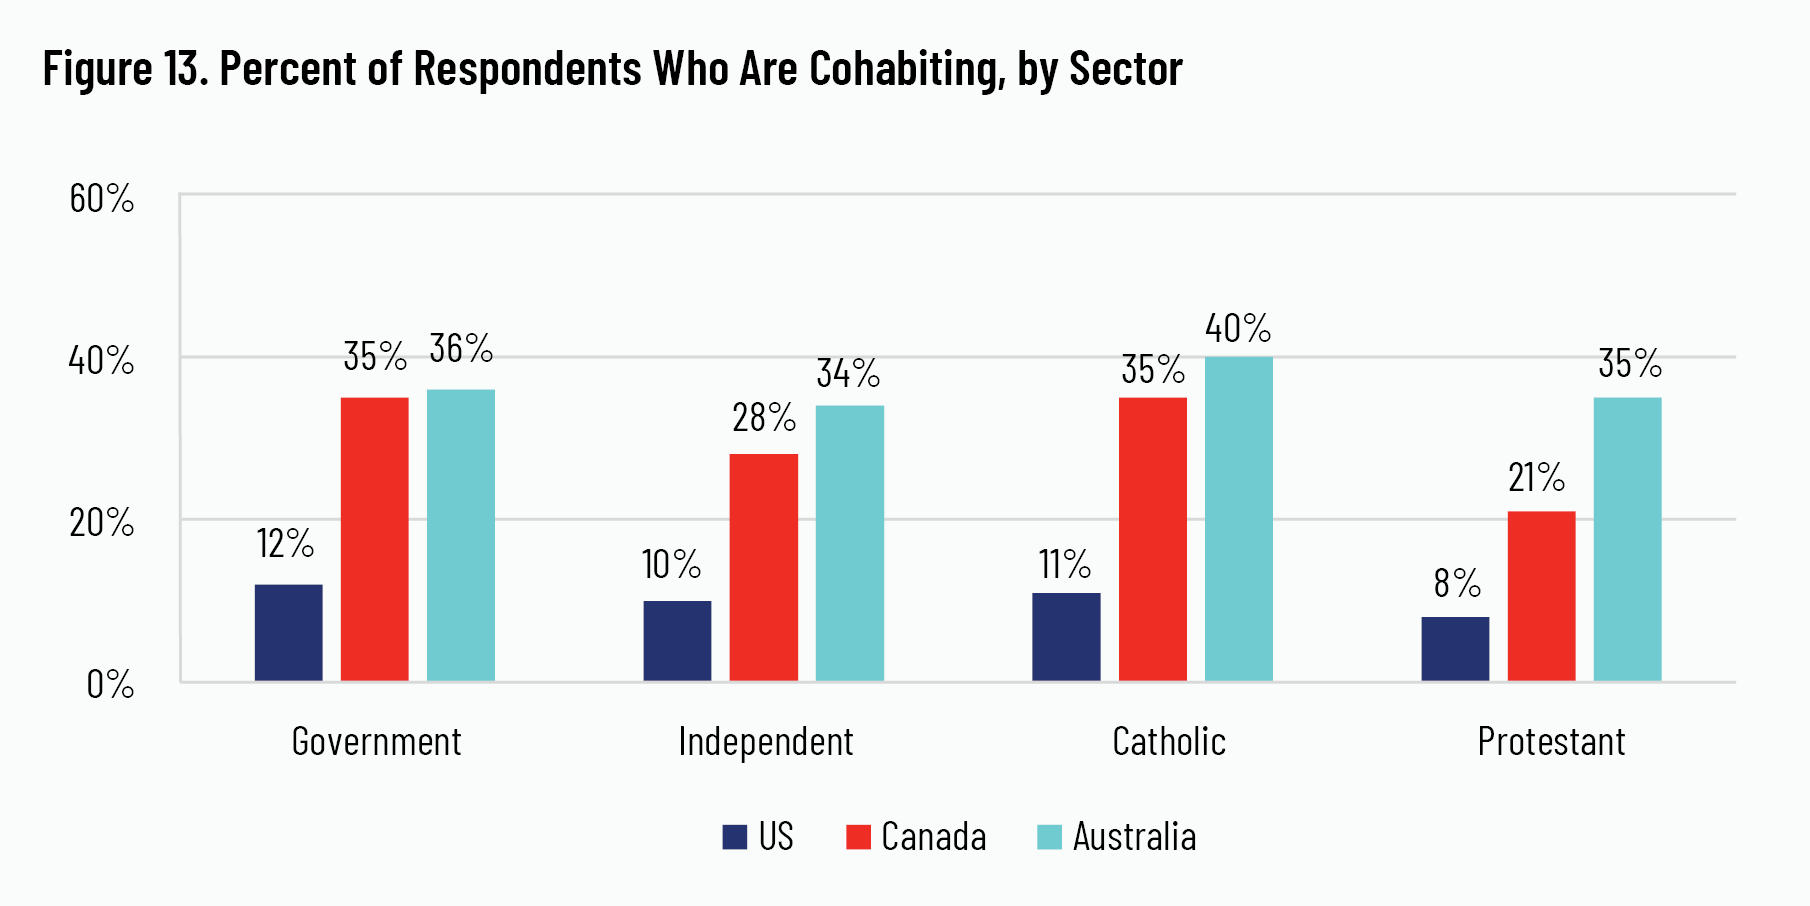
Marriage culture is quite different in the US, Canada, and Australia. While marriage rates for all three countries may be higher in some sectors—the Protestant-school sector, specifically—the relative rank ordering of each country’s averages is consistent. This finding suggests that although specific school sectors shape conceptions of marriage and family in distinctive ways, broader cultural conceptions about marriage and family within each country appear to influence CES respondents significantly. Given the importance of healthy marriages and family life for the well-being of children, the contrasts across the US, Canada, and Australia underscore the importance of the marriage institution within each country’s broader culture as well as how schools might play a role in shaping it.
4. Religiosity
A substantial body of evidence from fields such as sociology and psychology demonstrates the important role of religion for individual and communal well-being. 38 38 T.J. VanderWeele, “Activities for Flourishing: An Evidence-Based Guide,” Journal of Positive Psychology & Wellbeing 4, no. 1 (2020): 79–91. The Cardus Education Survey queried respondents regarding their participation in religious life and engagement with a variety of religious practices. While many additional religious practices can be considered, the questionnaires given to American, Canadian, and Australian CES respondents all asked about their views about God and three faith practices: prayer, engagement with religious texts, and religious-service attendance.
Before exploring the results, however, the following context is worth noting. Americans are considerably more religious than Canadians and Australians. Over half (55 percent) of Americans pray every day, compared to one-quarter (25 percent) of Canadians and less than one-fifth (18 percent) of Australians. Albeit, near-identical shares report religion to be very important to their lives, in each respective country. 39 39 D. Fahmy, “Americans Are Far More Religious than Adults in Other Wealthy Nations,” Pew Research Center, 2018, https://www.pewresearch.org/fact-tank/2018/07/31/americans-are-far-more-religious-than-adults-in-other-wealthy-nations/.
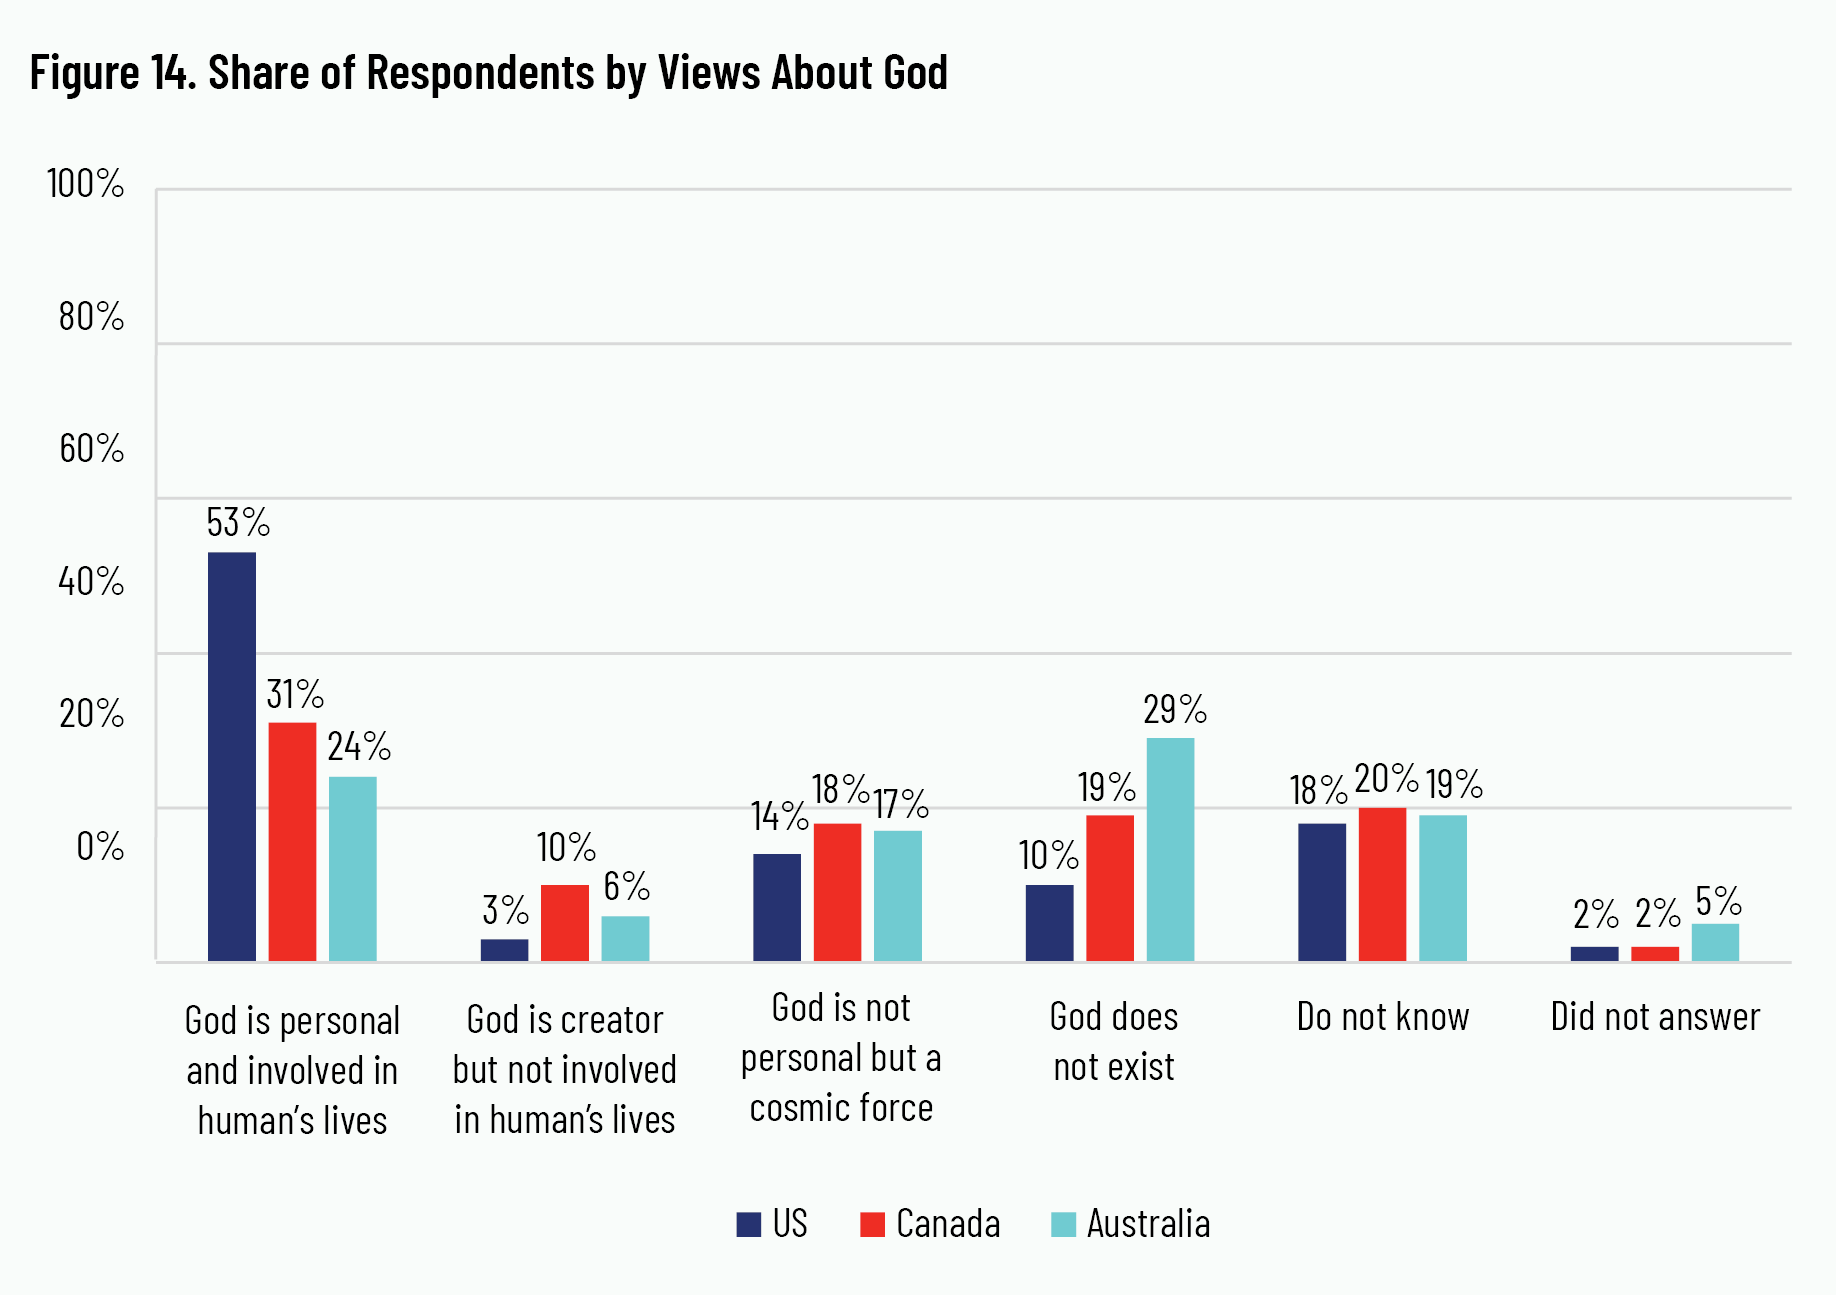
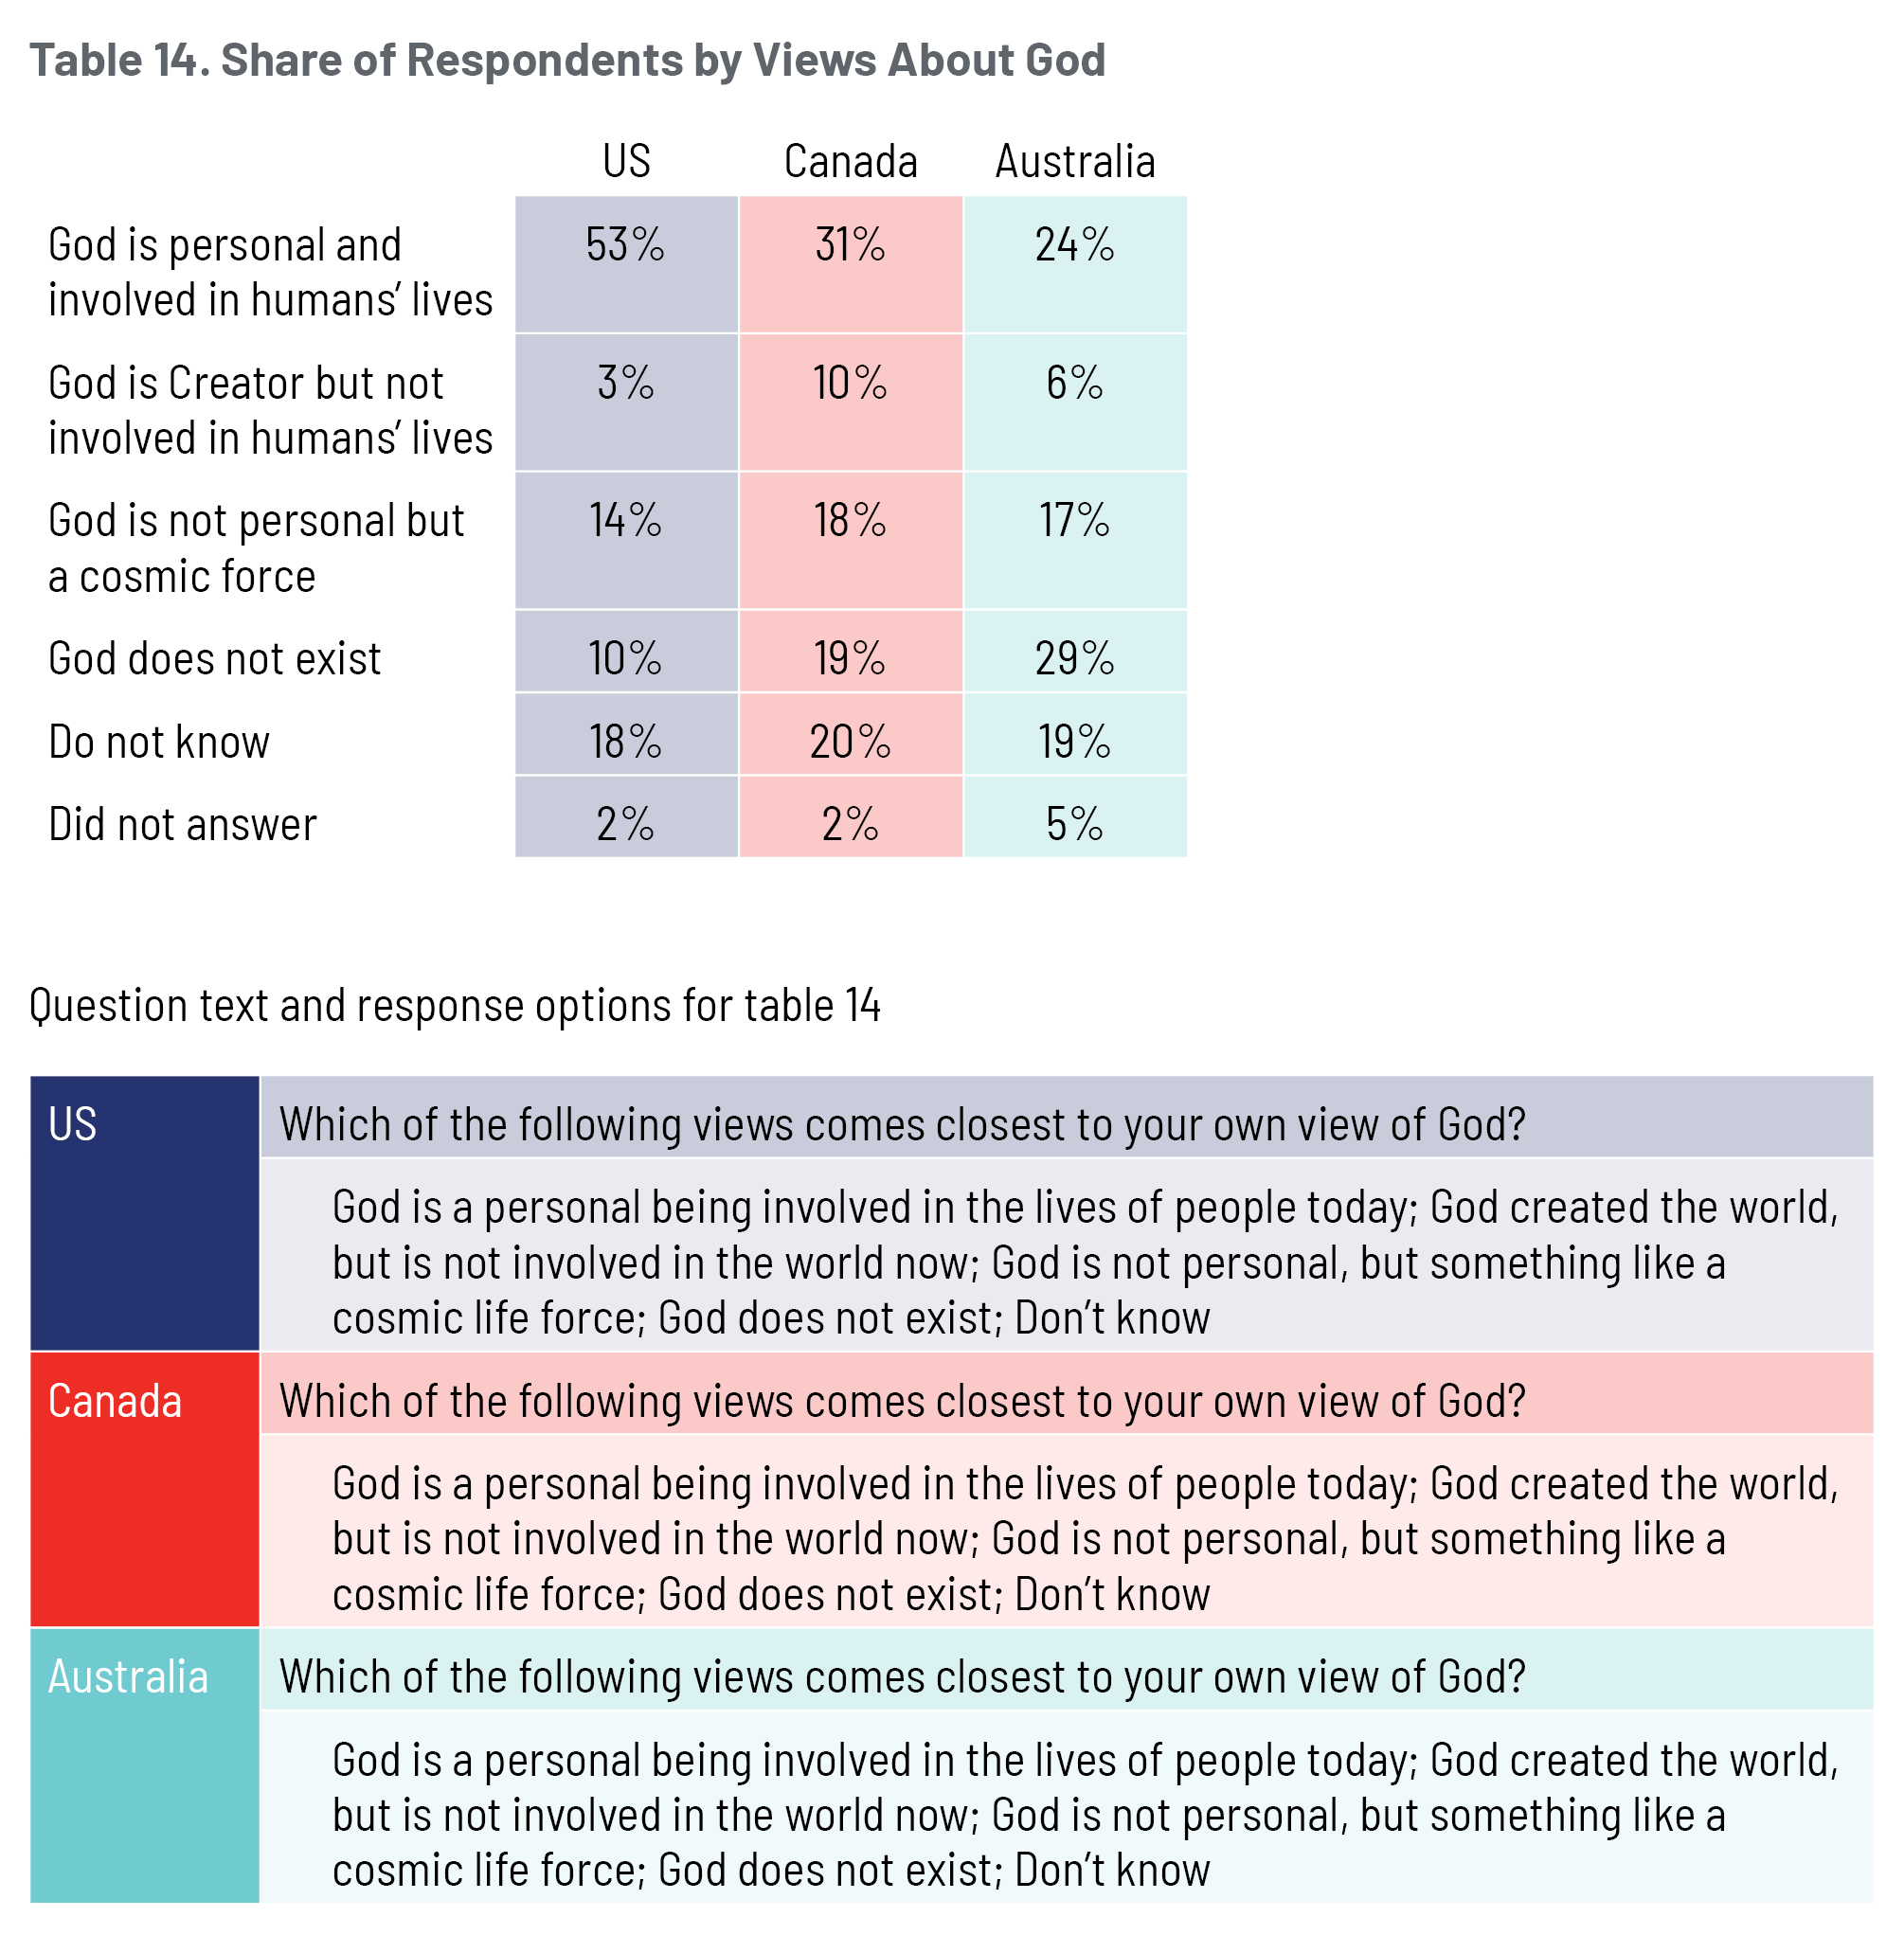
A higher prevalence of American respondents than Canadian or Australian respondents believe that “God is a personal being and involved in the lives of people today,” as opposed to God being an impersonal “cosmic force,” the “Creator but not involved in the world,” or nonexistent. Just over half of American respondents ascribed to a view of a personal, involved God. In contrast, 31 percent of Canadian respondents and 24 percent of Australian respondents held the same view. These results are depicted in figure 14.
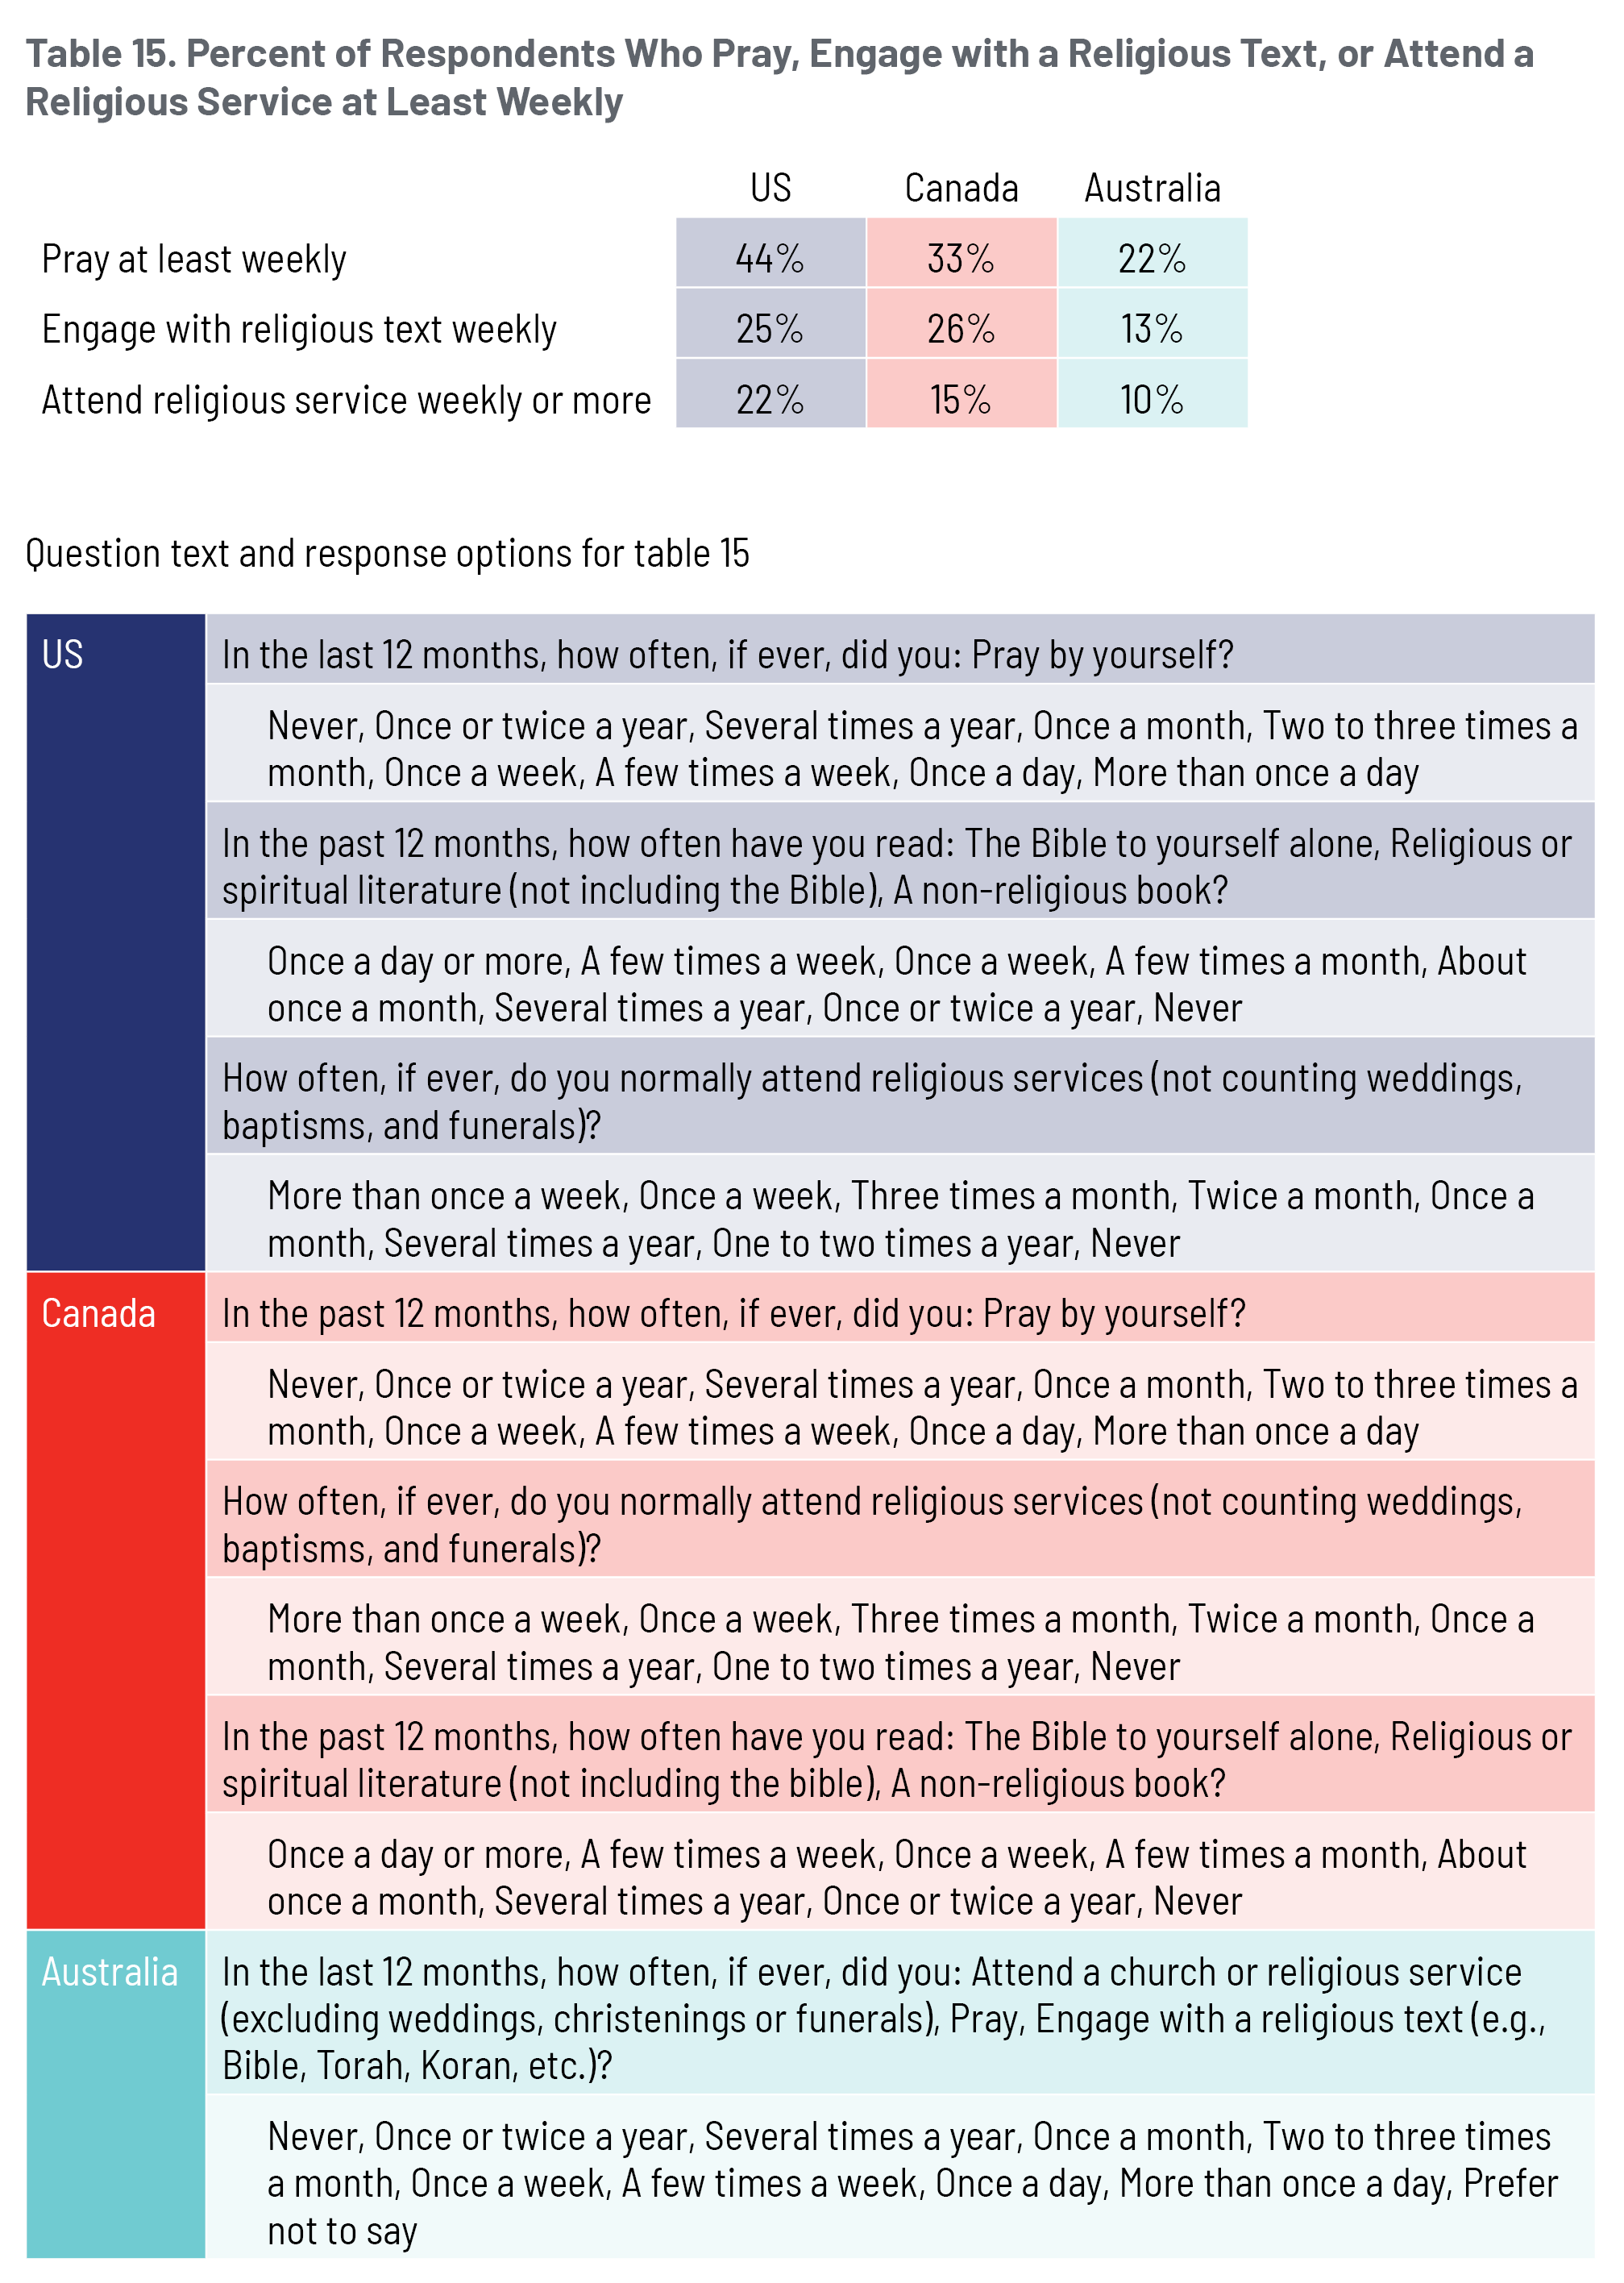
As displayed in figure 15, about 44 percent of American respondents reported praying at least weekly. Meanwhile, 33 percent of Canadian and 22 percent of Australian respondents reported praying with the same frequency. We observe a similar trend when considering engagement with a religious text, which is practiced less regularly by respondents from all three countries. About one-quarter of American and Canadian respondents engaged with a religious text at least weekly. These rates contrast with Australian respondents where 12 percent report that they engage with a religious text at least weekly.
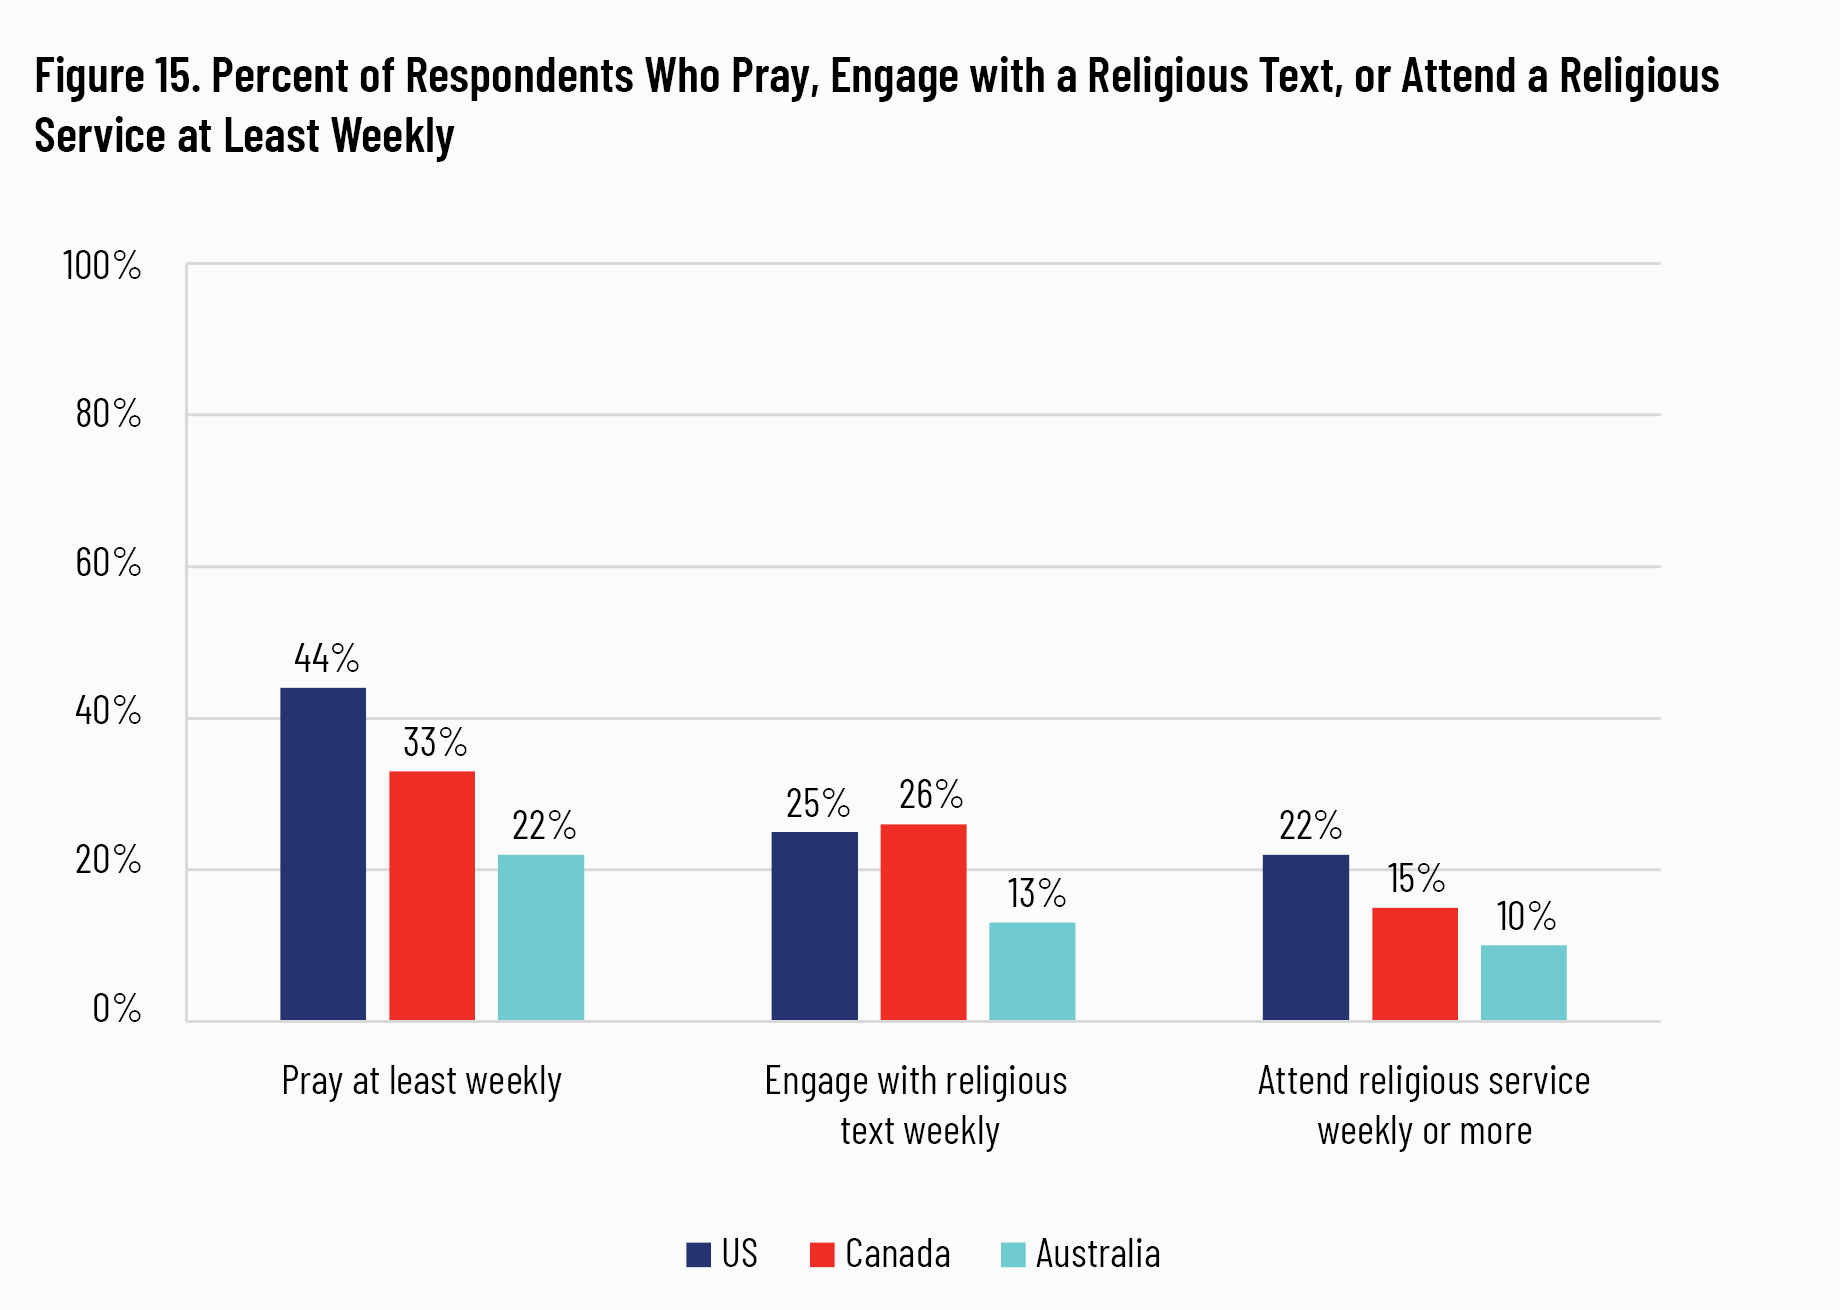
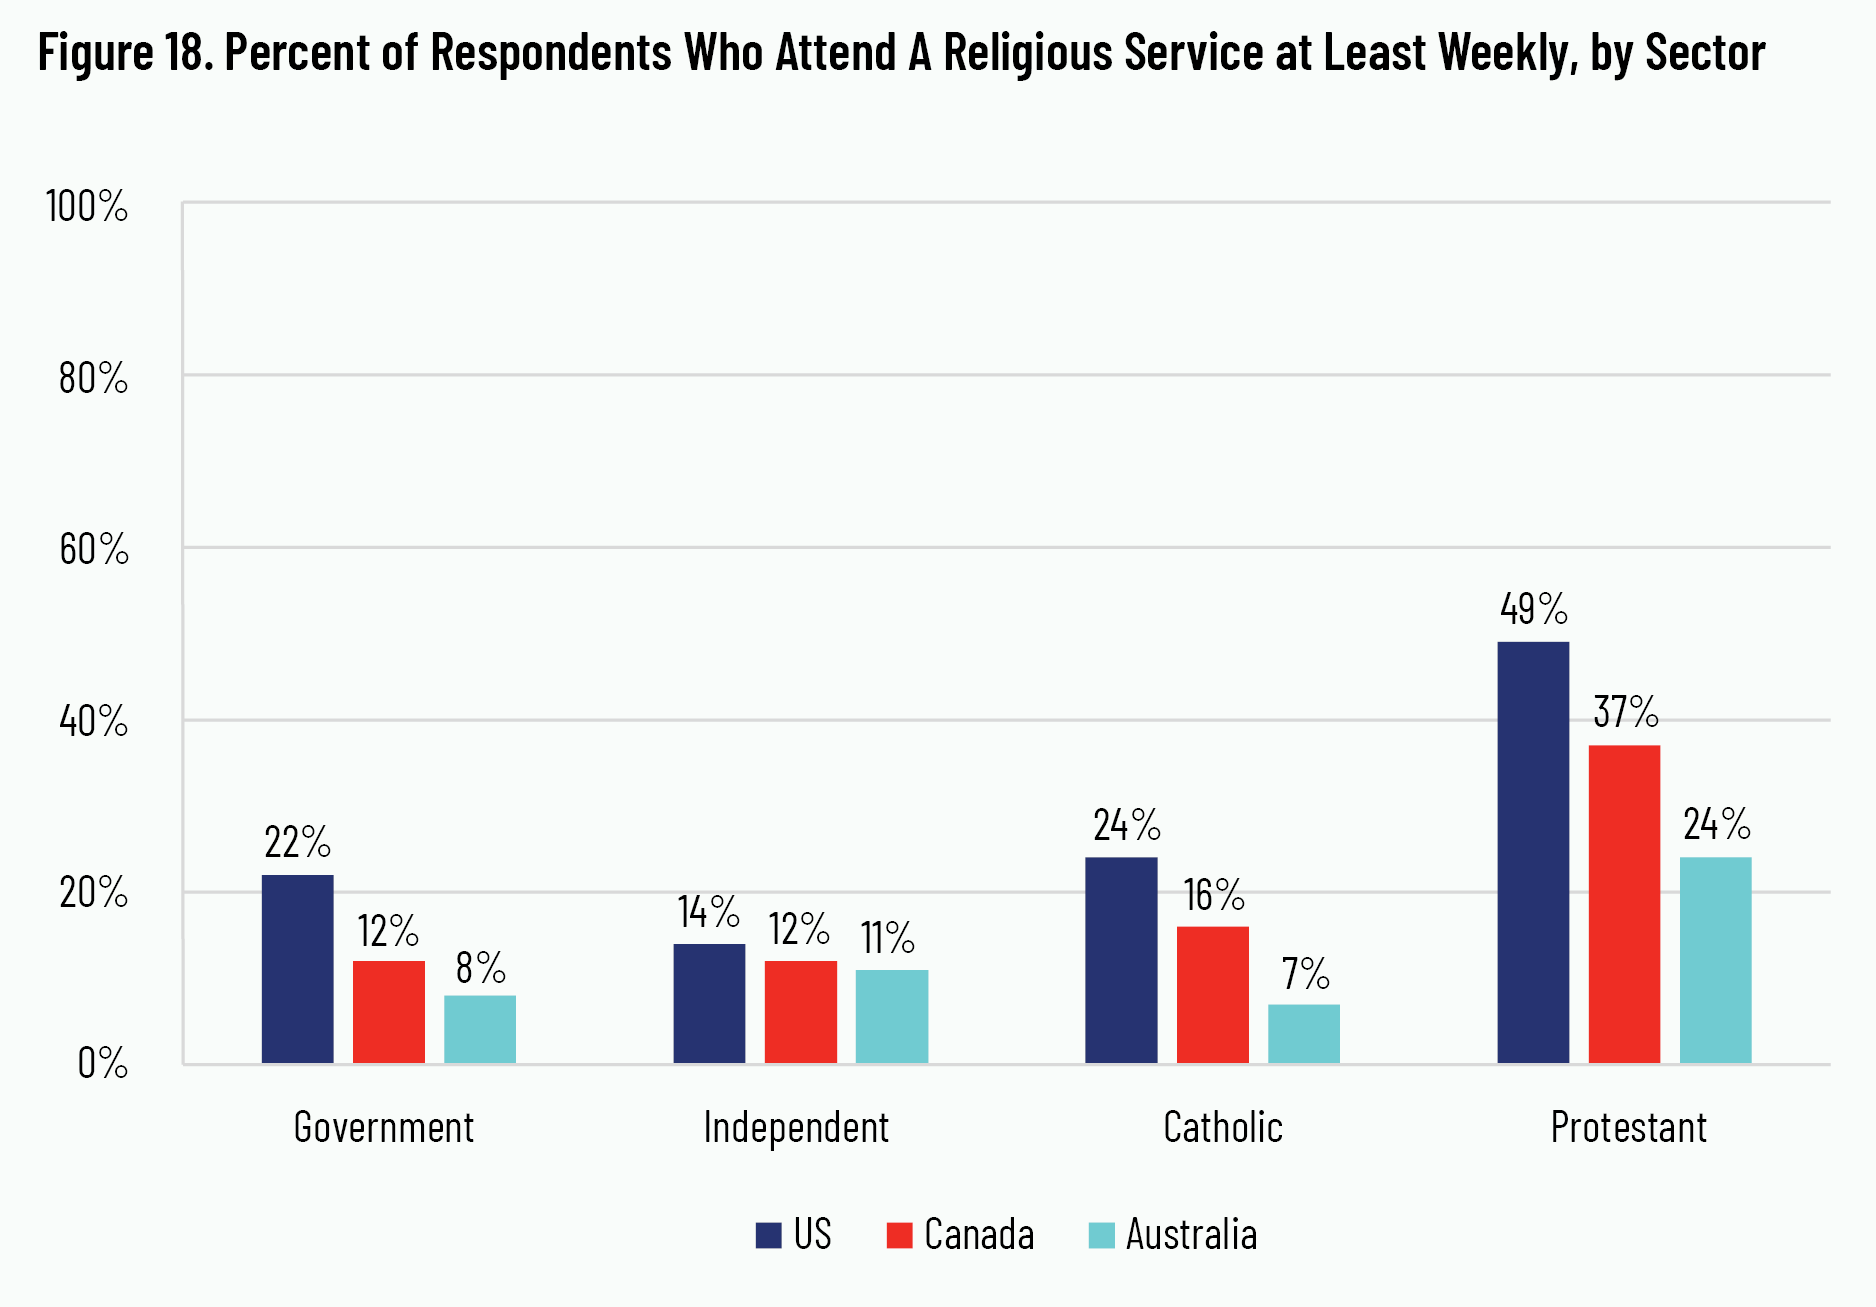
Also displayed in figure 15 are findings about religious-service attendance. Rates of attending religious services at least weekly are lowest in Australia compared to Canada and the US. One-tenth of Australian respondents in our sample report attending religious services at least once per week. The rates among Canadian and American respondents is 15 percent and 22 percent, respectively.
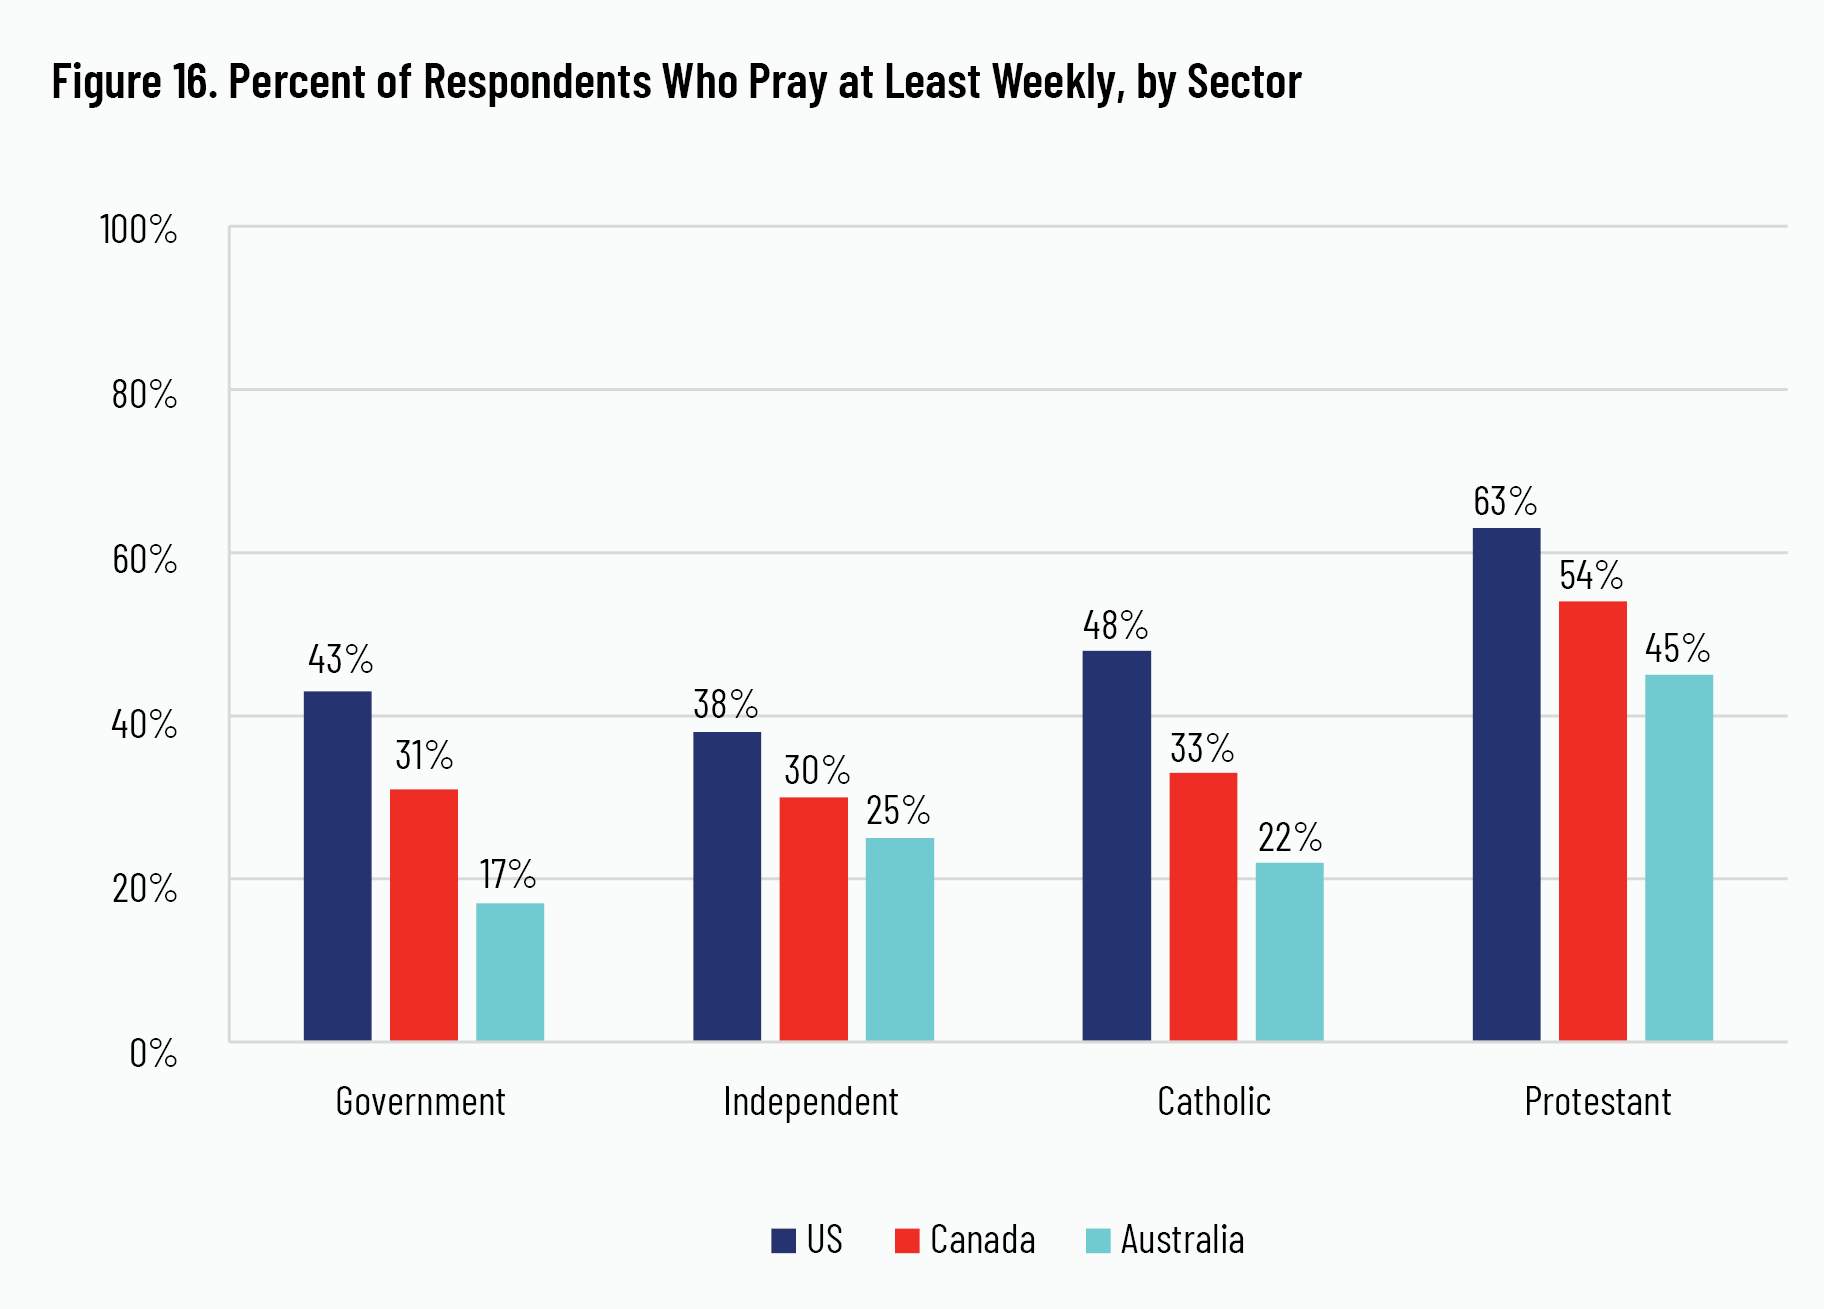
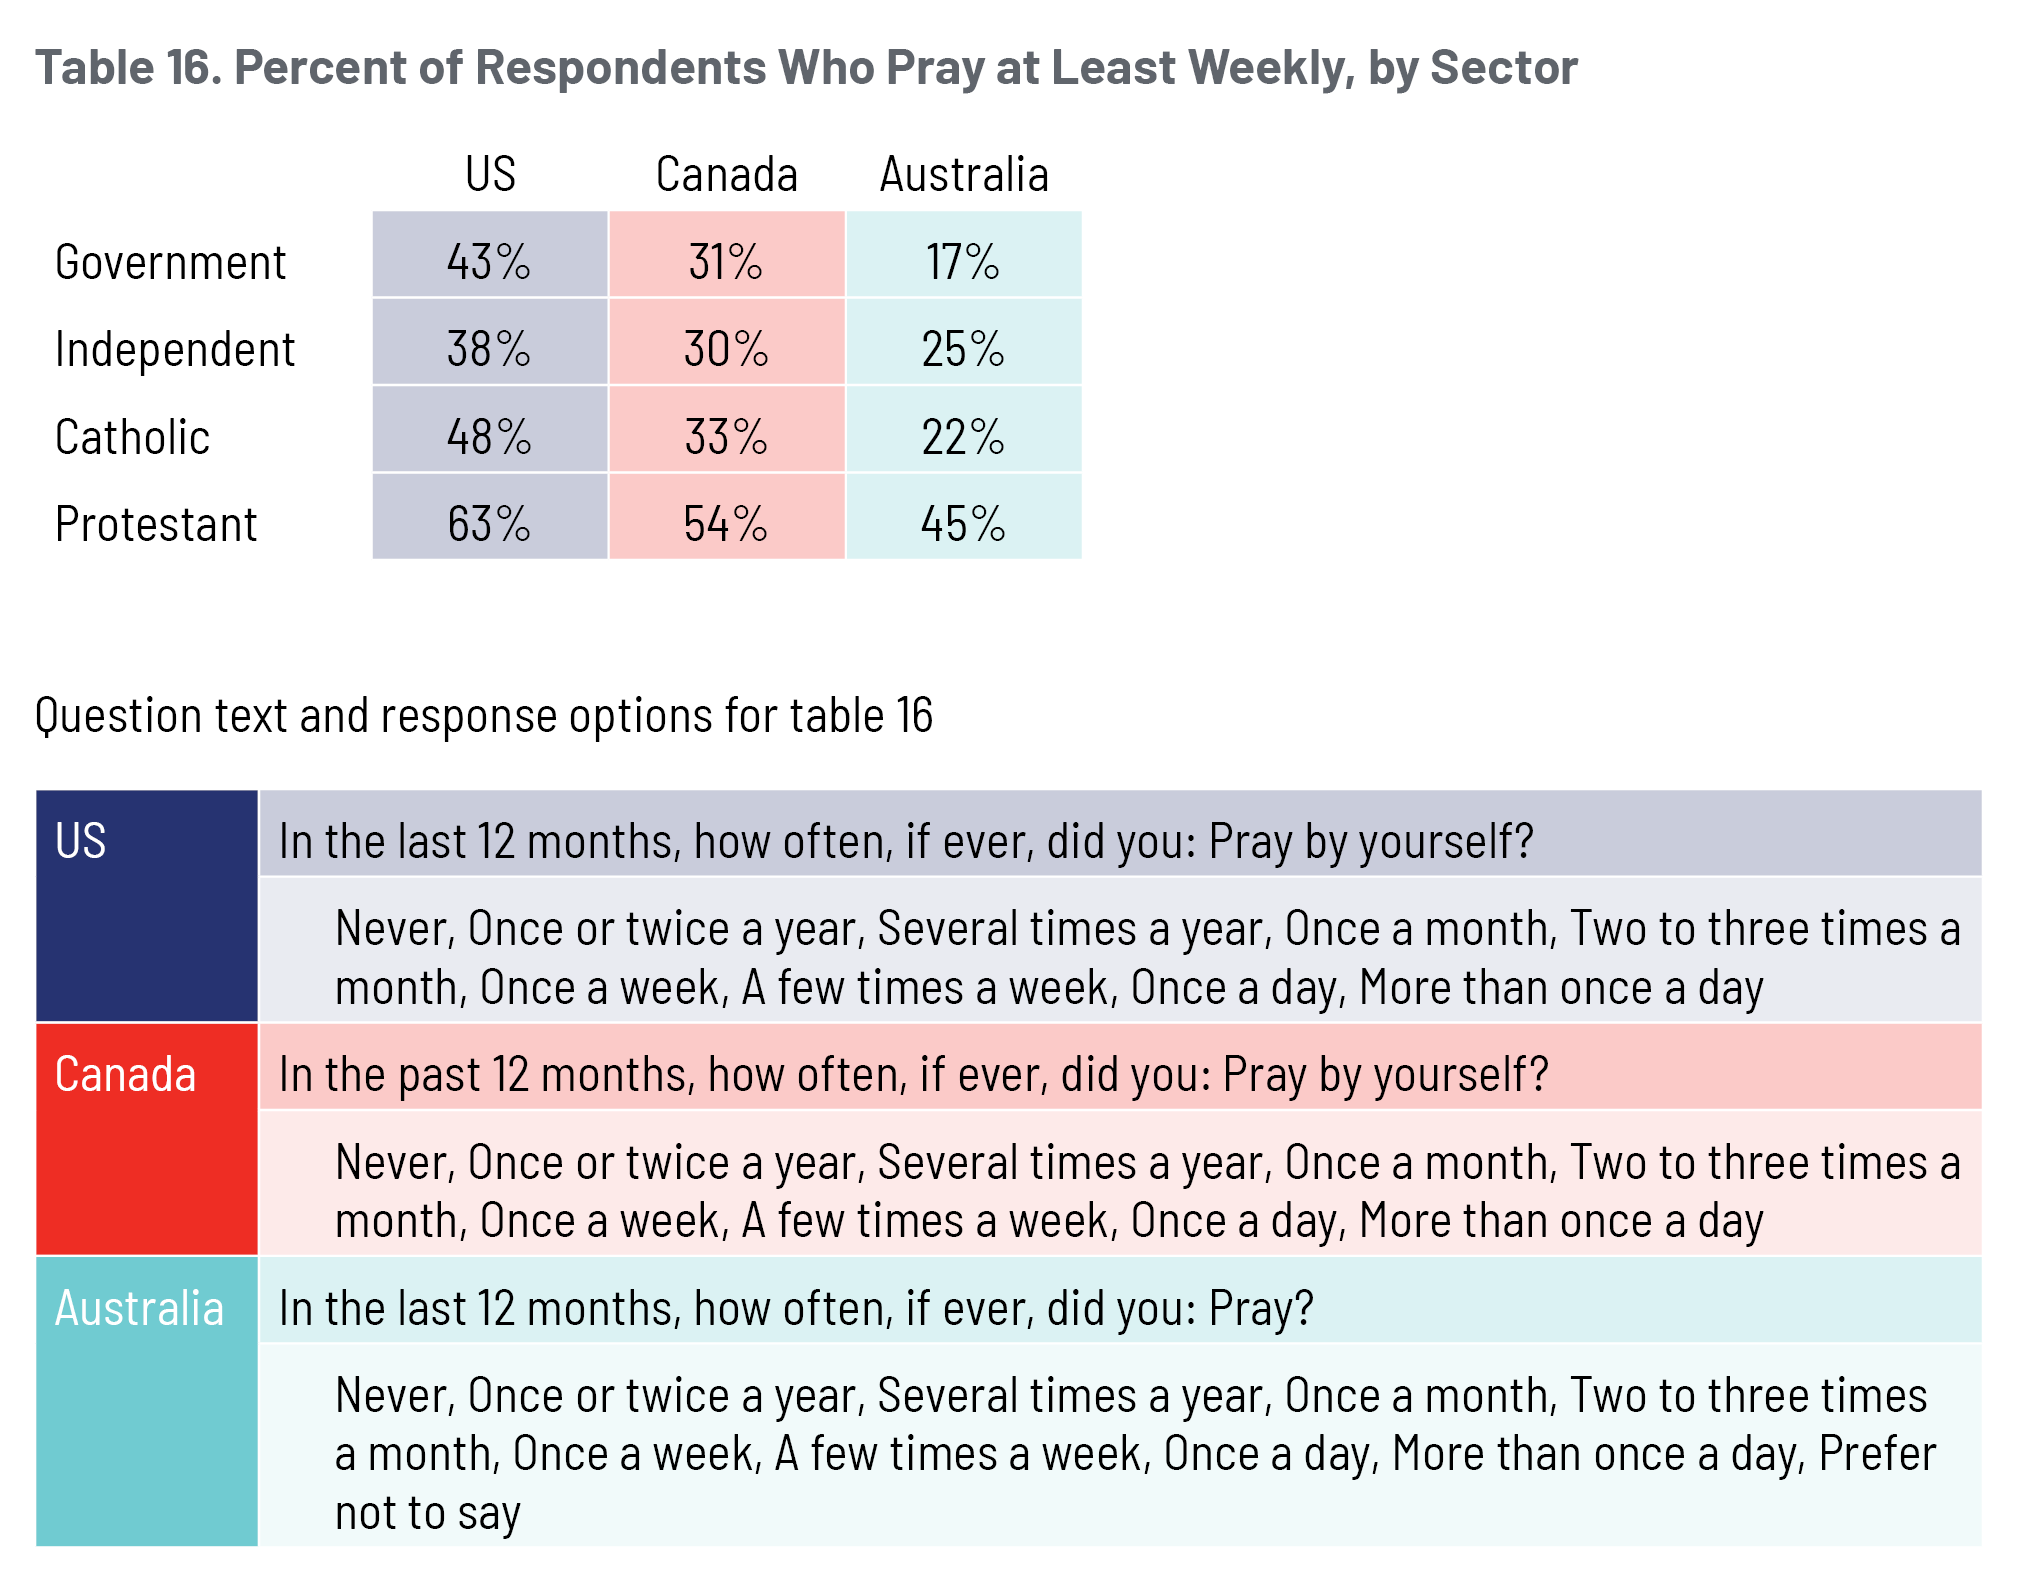
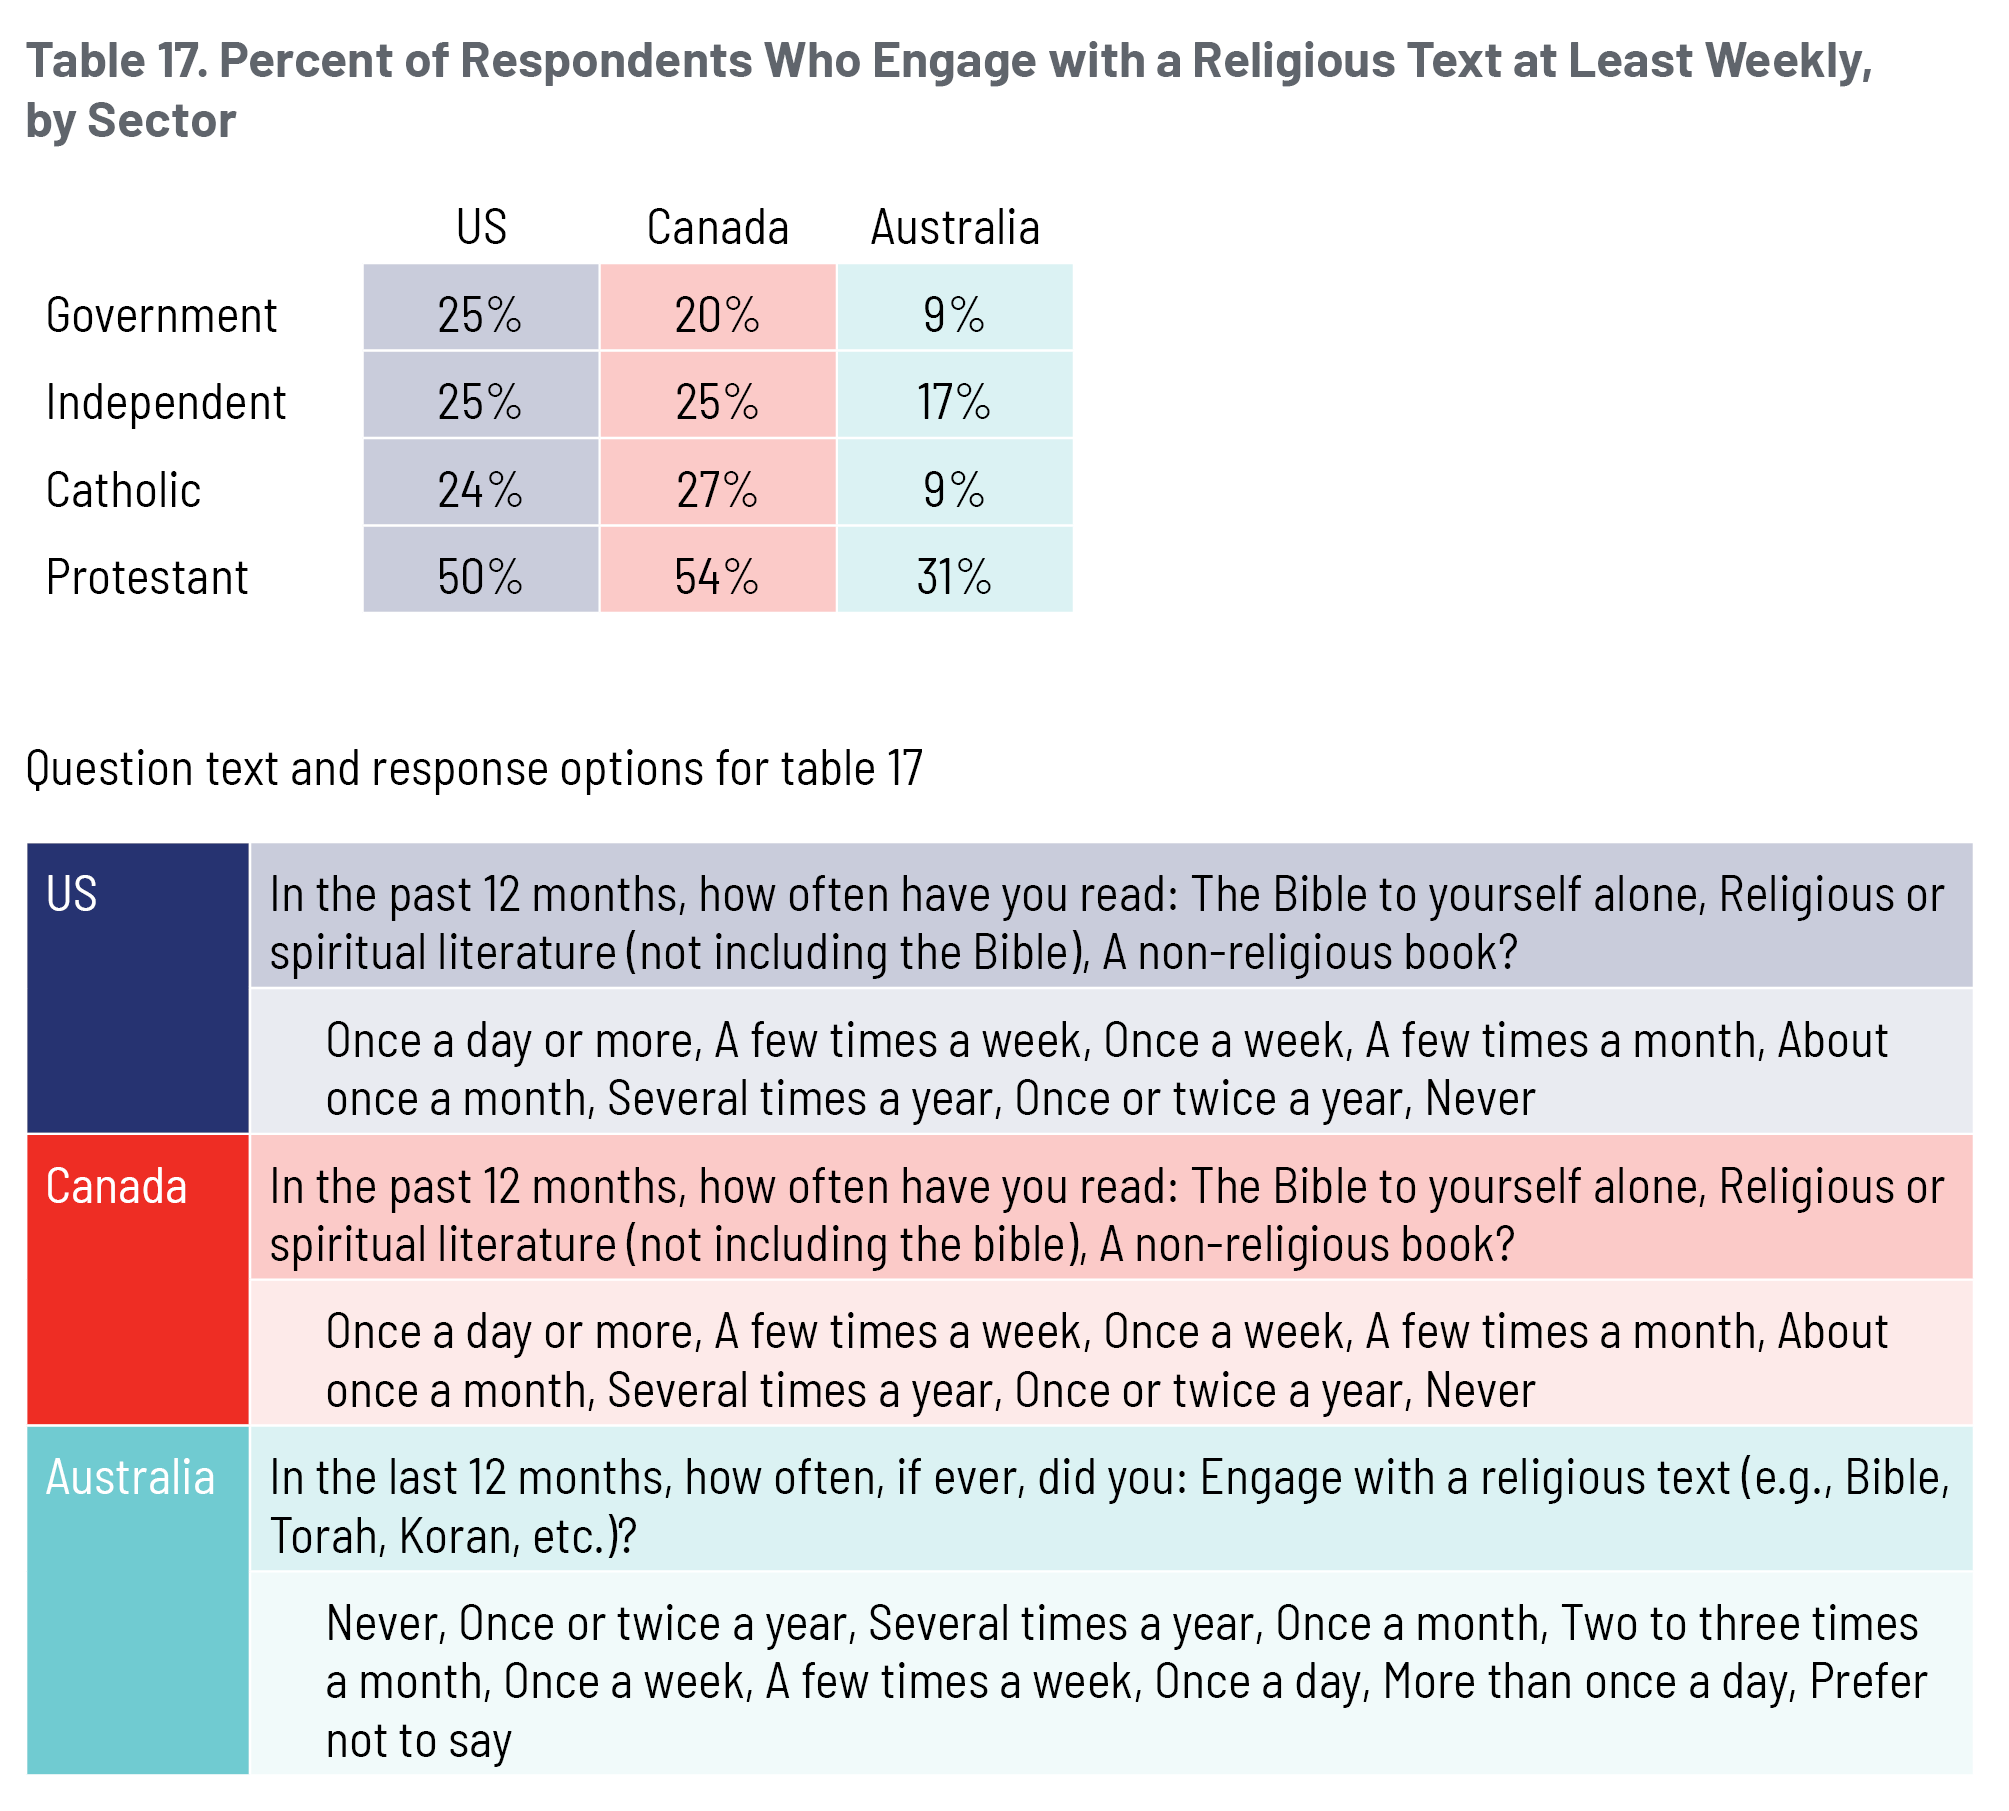
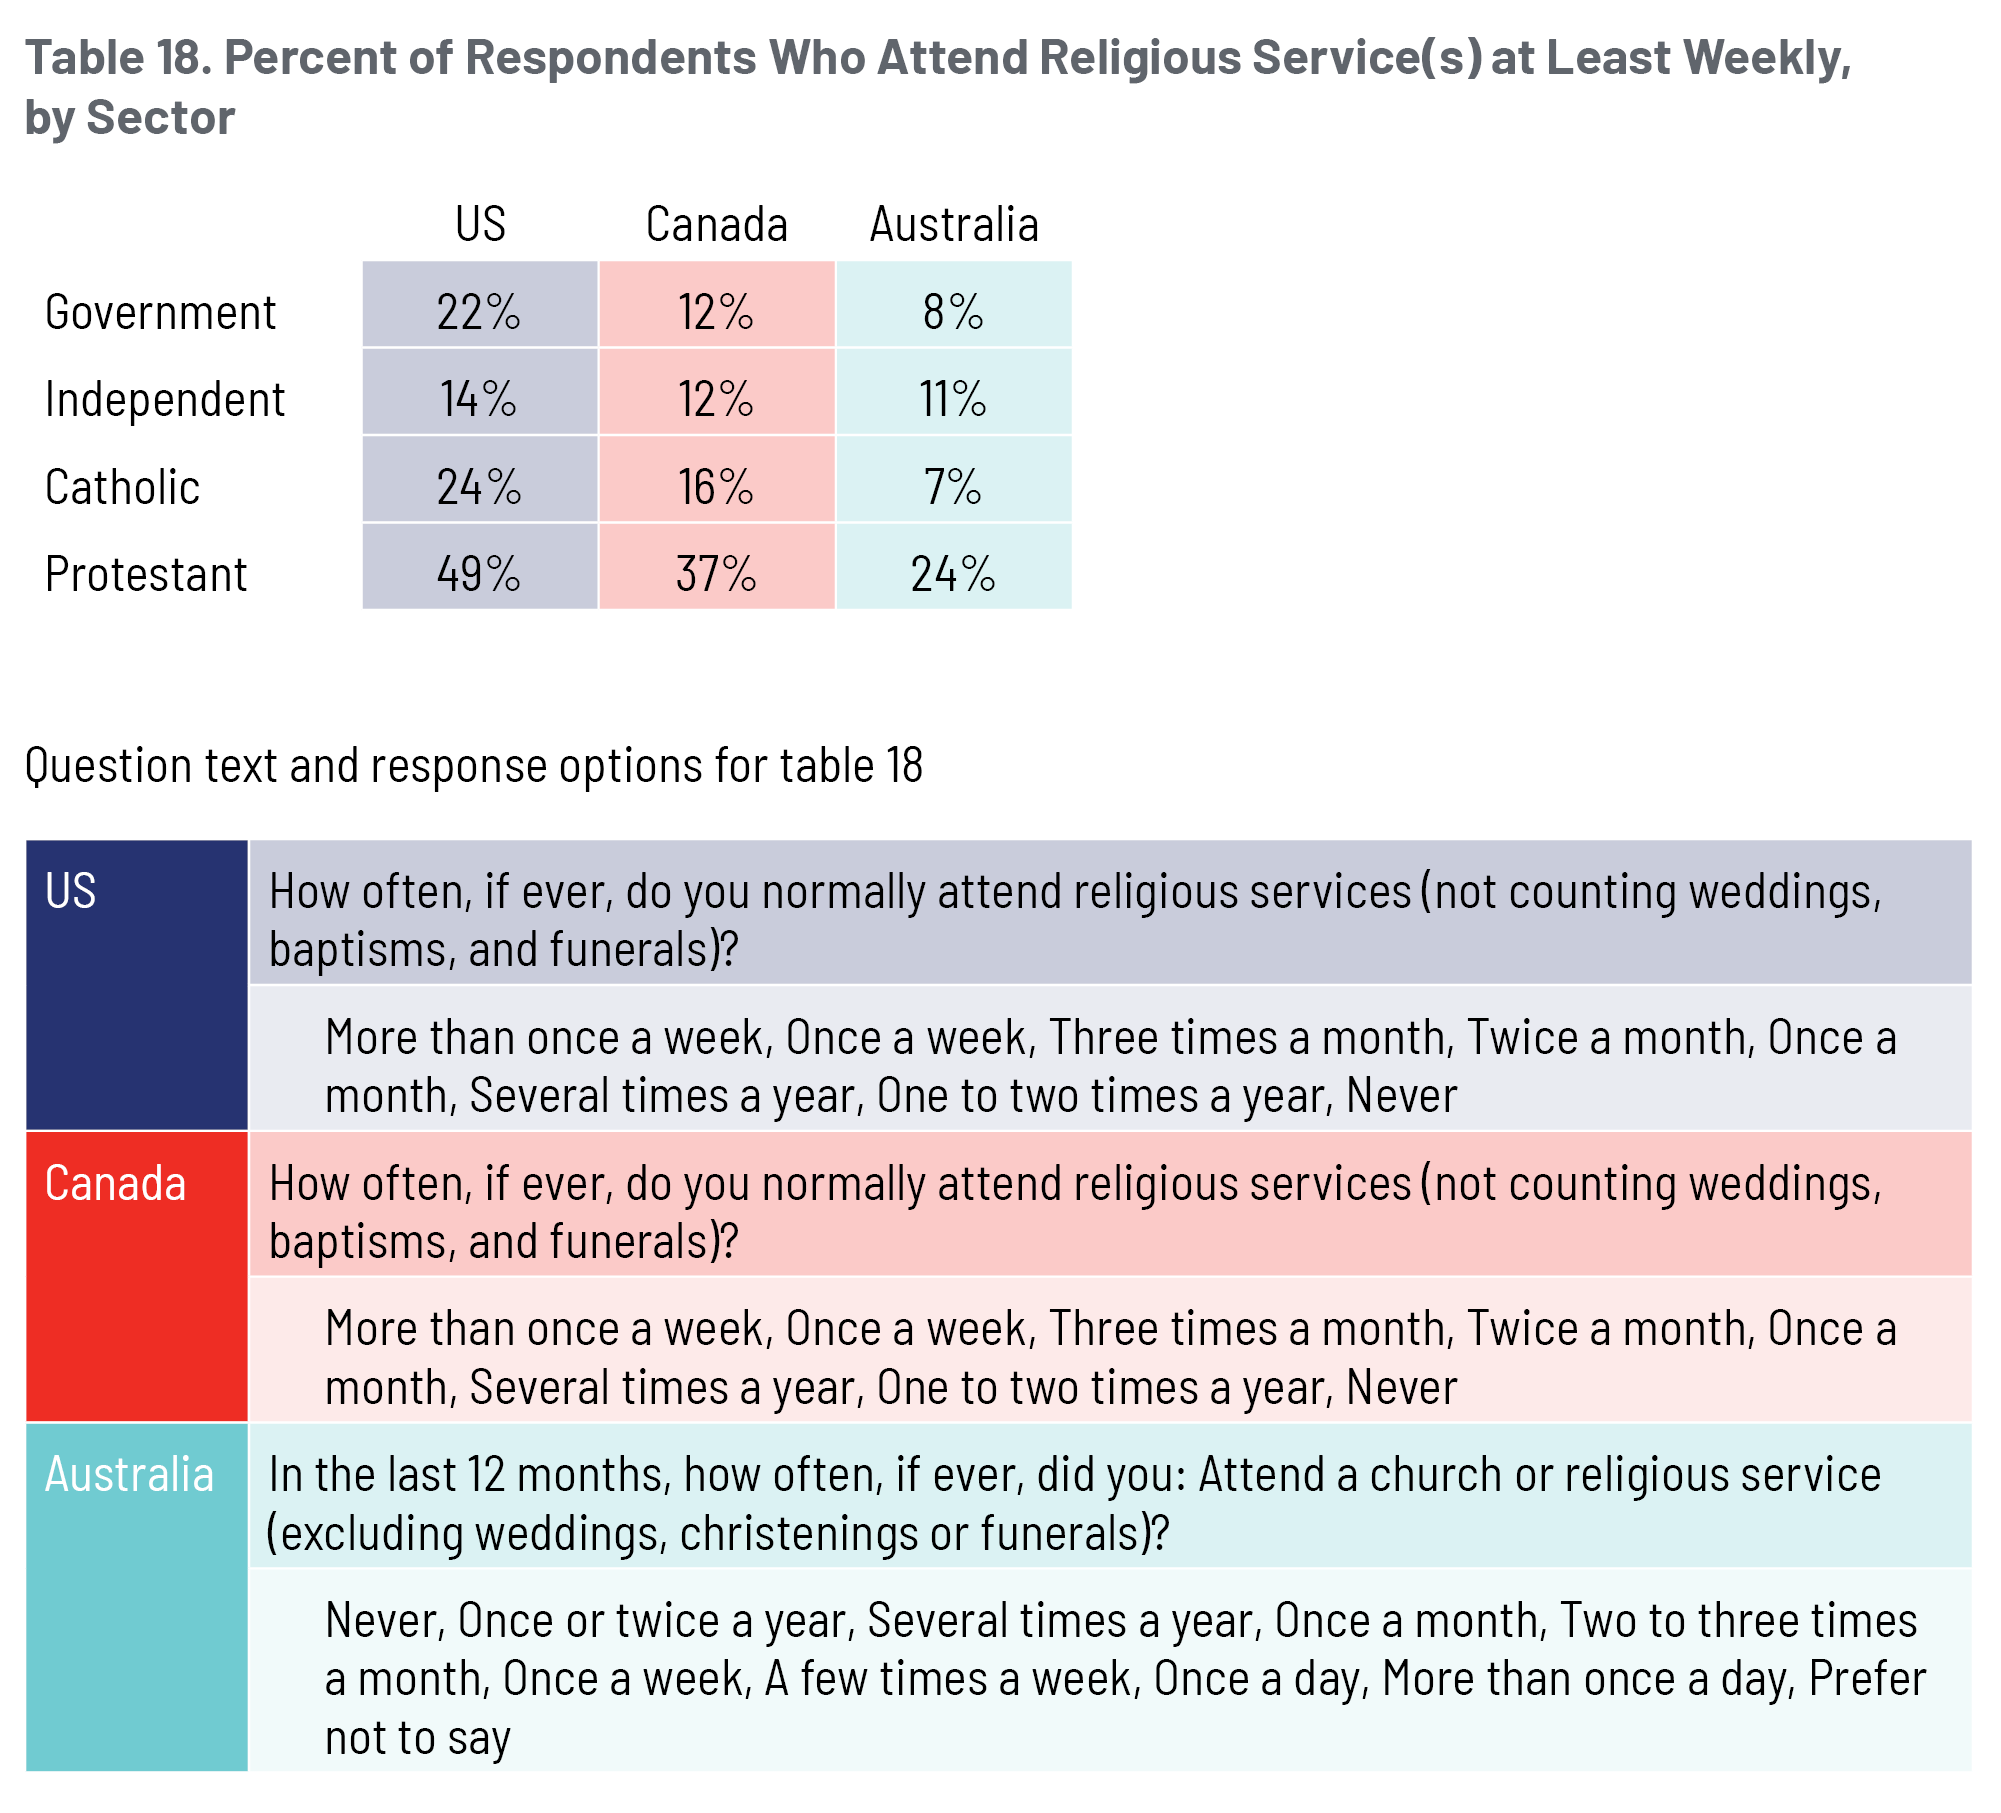
The absolute levels of the frequency of prayer, engagement with religious texts, and religious service attendance changes for Protestant-school graduates relative to each country’s overall levels. Protestant-school graduates are most likely to engage in these practices compared to graduates from the other sectors. Meanwhile, graduates of government, independent, and Catholic schools within each country pray and engage with a religious text at similar levels of frequency. These patterns are presented in figures 16, 17, and 18.
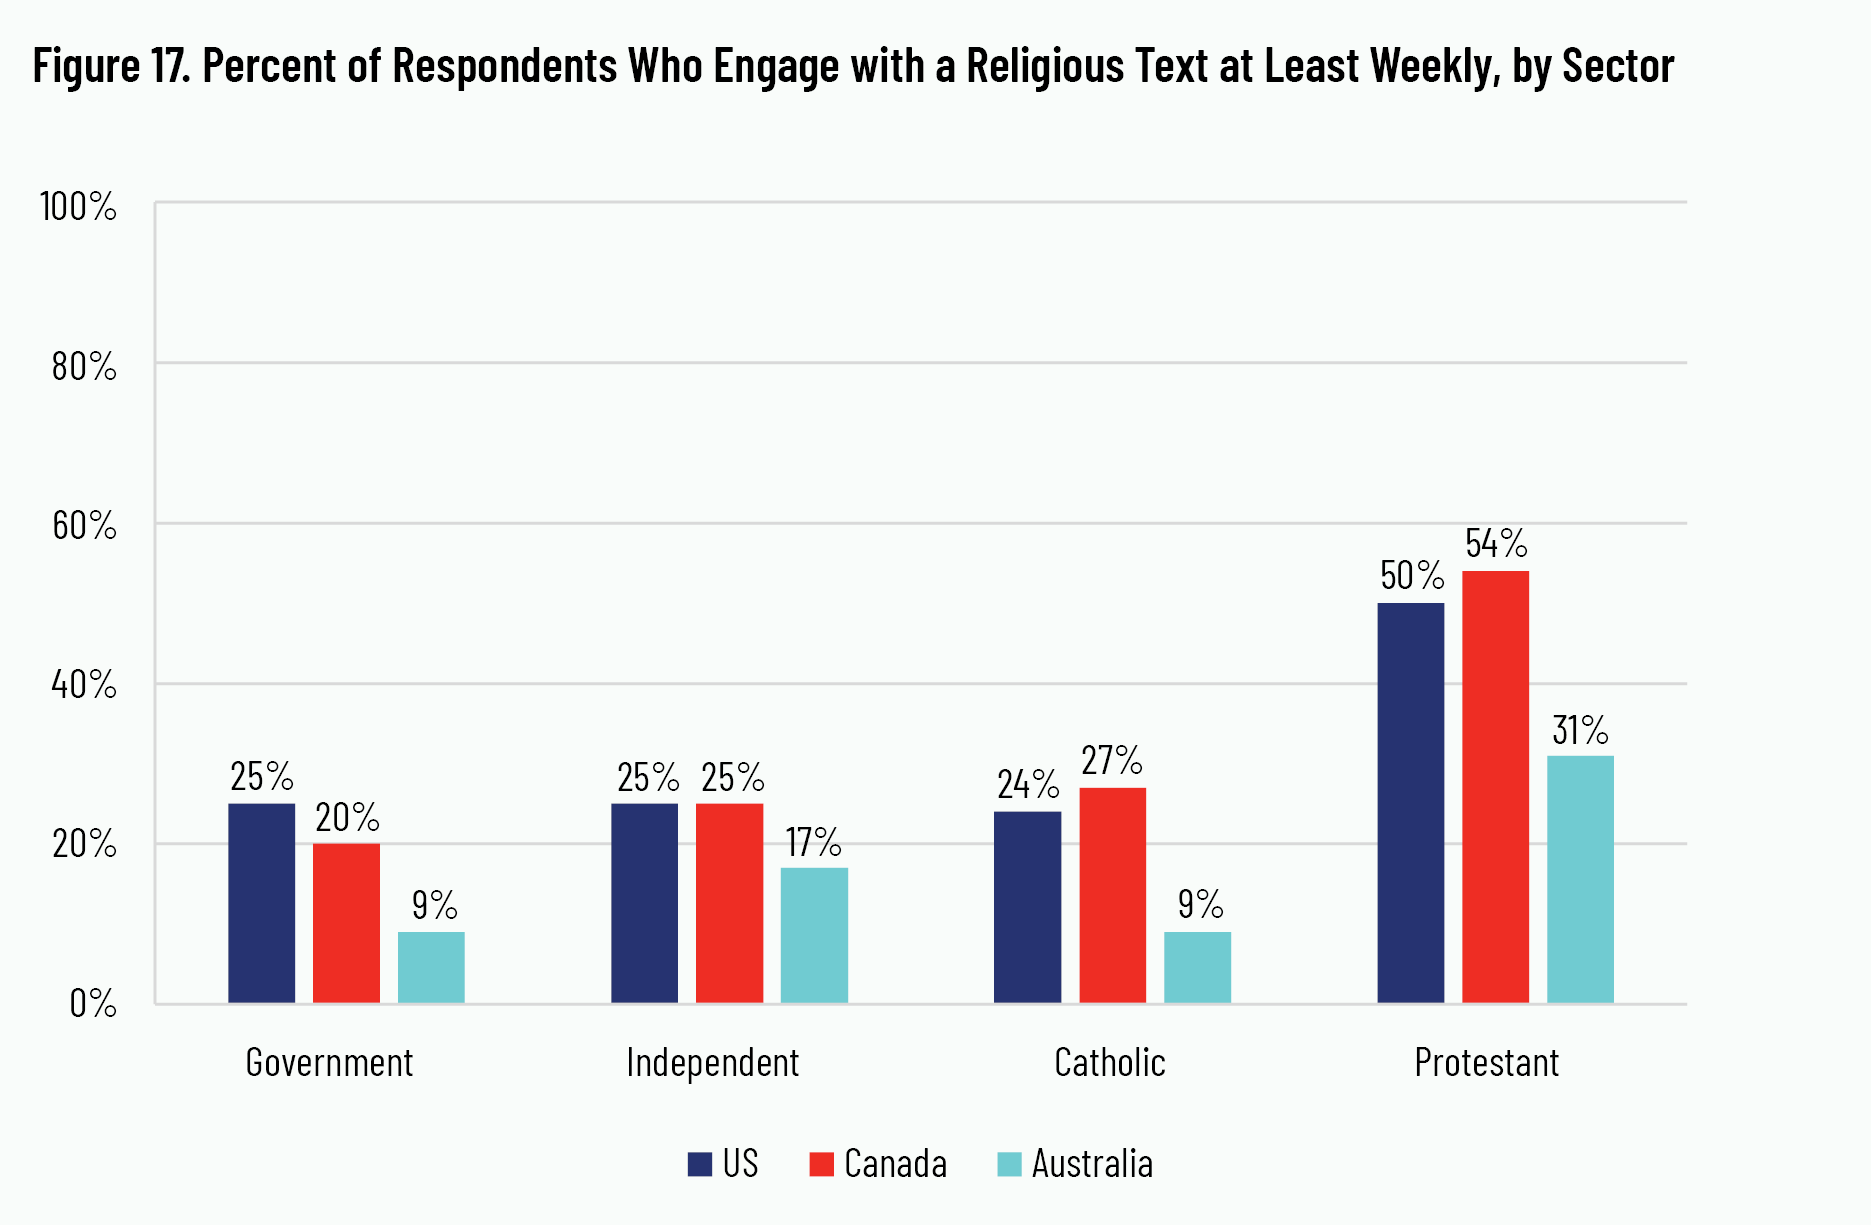
Considering the Protestant-school sector alone, however, religiosity on all three measures is consistently higher among American and Canadian respondents than among Australian respondents. For example, 45 and 31 percent of Australian Protestant-school graduates report praying and engaging with a religious text, respectively, at least weekly. These proportions are higher than the average Australian, but they are considerably lower than the average Protestant-school graduate in the US and Canada, where at least half of them engage in these religious practices on a weekly basis. In fact, almost two out of every three American Protestant-school graduates pray at least once a week.
Concluding Remarks
Different schools and school sectors have also at times competed against one another to argue which delivers better educational outcomes. Such experiences are unsurprising in pluralistic societies where there are differences in values, priorities, and visions of the good life. Nonetheless, such pluralism presents opportunities for people to learn from one another.
We offer this report with aspirations that it will bring together educational leaders, policy-makers, families, and many others interested in school improvement to consider and converse about what we found regarding graduates of American, Canadian, and Australian secondary schools. We hope that the differences and similarities we have documented across the three countries raise more questions than we can answer. After all, we do not have the data or empirical tools to identify reasons behind the patterns we have observed across the three countries. We look forward to the many conjectures and hypotheses that readers will raise to potentially explain the differences we observe. Perhaps they will offer the tiniest of hints or spark the most modest of ideas for schools to more faithfully contribute to the common good.
Appendix
The data for all the figures of this report are presented in the tables below, for quick reference.
References
Allison, D., and D. Van Pelt. “Canada.” In Balancing Freedom, Autonomy and Accountability in Education, edited by C. Glenn and J. de Groof, 3:79–142. Nijmegen: Wolf Legal Publishers, 2012.
Allison, D., S. Hasan, and D. Van Pelt. “A Diverse Landscape: Independent Schools in Canada.” Fraser Institute, June 2016. https://www.fraserinstitute.org/sites/default/files/a-diverse-landscape-independent-schools-in-canada.pdf.
Australian Bureau of Statistics. “Schools: Data on Students, Staff, Schools, Rates and Ratios for Government and Non-government Schools, for All Australian States and Territories,” Australian Government, February 2021. https://www.abs.gov.au/statistics/people/education/schools/latest-release.
Australian Department of Education, Skills and Employment. “How Are Schools Funded in Australia?” Australian Government, June 2021. https://www.dese.gov.au/quality-schools-package/fact-sheets/how-are-schools-funded-australia.
Canada Helps. “The Giving Report 2021: Faster Growth in Online Giving Crucial During Times of Crisis,” Canada Helps and Environics Analytics, 2021. https://www.canadahelps.org/media/The-Giving-Report-2021_EN.pdf.
Casagrande, M., R. Pennings, and D. Sikkink. “Cardus Education Survey 2018: Rethinking Public Education.” Cardus, 2019. https://www.cardus.ca/research/education/reports/rethinking-public-education/.
Charities Aid Foundation. “CAF World Giving Index 2018: A Global View of Giving Trends.” Charities Aid Foundation, October 2018. https://www.cafonline.org/docs/default-source/about-us-publications/caf_wgi2018_report_webnopw_2379a_261018.pdf.
Cheng, A., and D. Iselin. “Cardus Education Survey Australia: Australian Schools and the Common Good.” Cardus and Cardus Education Survey Australia Consortium, August 2020. https://carduseducationsurvey.com.au/wp-content/uploads/2020/08/Cardus-Education-Survey-Australia_Full-Report-Final.pdf.
De Brey, C., T.D. Snyder, A. Zhang, and S.A. Dillow. “Digest of Education Statistics 2019.” National Center for Education Statistics, Institute of Education Sciences, US Department of Education, 2021. NCES 2021-009.
DeAngelis, C.A., P.J. Wolf, L.D. Maloney, and J.F. May. “Charter School Funding: Inequity Surges in the Cities.” School Choice Demonstration Project, University of Arkansas, 2020, https://files.eric.ed.gov/fulltext/ED612068.pdf.
EdChoice. “The ABCs of School Choice: The Comprehensive Guide to Every Private School Choice Program in America.” March 2021. https://www.edchoice.org/wp-content/uploads/2021/03/2021-ABCs-of-School-Choice-WEB-2-24.pdf.
Fahmy, D. “Americans Are Far More Religious than Adults in Other Wealthy Nations.” Pew Research Center, 2018. https://www.pewresearch.org/fact-tank/2018/07/31/americans-are-far-more-religious-than-adults-in-other-wealthy-nations/.
Green, B., D. Sikkema, and D. Sikkink. “Cardus Education Survey 2018: British Columbia Bulletin.” Cardus, 2018. https://www.cardus.ca/research/education/reports/cardus-education-survey-2018-british-columbia-bulletin/.
———. “Cardus Education Survey 2018: Ontario Bulletin.” Cardus, 2018. https://www.cardus.ca/research/education/reports/cardus-education-survey-2018-ontario-bulletin/.
Green, B., D. Sikkema, D. Sikkink, S. Skiles, and R. Pennings. “Cardus Education Survey 2016: Educating to Love Your Neighbour.” Cardus, 2016. https://www.cardus.ca/research/education/reports/cardus-education-survey-2016-educating-to-love-your-neighbour/.
Hunt, D., A. Momoh, and D. Van Pelt. “Funding All Students: A Comparative Economic Analysis of the Fiscal Cost to Support Students in Ontario Independent Schools.” Cardus, September 2021. https://www.cardus.ca/research/education/reports/the-cost-to-fund-students-in-ontario-independent-schools/.
MacPherson, P., J. Emes, and N. Li. “Education Spending in Public Schools in Canada.” Fraser Institute, Fall 2021. https://www.fraserinstitute.org/studies/education-spending-in-public-schools-in-canada-fall-2021.
Mcgregor-Lowndes, M., M. Balczun, and A. Williamson. “An Examination of Tax-Deductible Donations Made by Individual Australian Taxpayers in 2018–19: ACPNS Working Paper No. 74.” The Australian Centre for Philanthropy and Nonprofit Studies, Queensland University of Technology, 2021. https://eprints.qut.edu.au/212682/9/An_examination_of_tax_deductible_donations_made_by_individual_Australian_taxpayers_in_201819.pdf.
Ortiz-Ospina, E., and M. Roser. “Marriages and Divorces.” Our World in Data, 2020. https://ourworldindata.org/marriages-and-divorces.
Pennings, R., D. Sikkink, A. Berner, C. Smith, M. Berends, J. Dallavis, and S. Skiles. “Cardus Education Survey 2014: Private Schools for the Public Good.” Cardus, 2014. https://www.cardus.ca/research/education/reports/cardus-education-survey-2014-private-schools-for-the-public-good/.
Pennings, R., D. Sikkink, D. Van Pelt, H. Van Brummelen, and A. von Heyking. “Cardus Education Survey: A Rising Tide Lifts All Boats.” Cardus, 2012. https://www.cardus.ca/research/education/reports/cardus-education-survey-phase-ii-report-2012/.
Pennings, R., J. Seel, D. Van Pelt, D. Sikkink, and K. Wiens. “Cardus Education Survey: Do the Motivations for Private Religious Catholic and Protestant Schooling in North America Align with Graduate Outcomes?” Cardus, 2011. https://www.cardus.ca/research/education/reports/cardus-education-survey-phase-i-report-2011/.
Philanthropy Roundtable. “Who Gives Most to Charity?” Philanthropy Roundtable, 2022. https://www.philanthropyroundtable.org/almanac/statistics/who-gives.
Statistics Canada. “Table 37-10-0109-01: Number of Students in Elementary and Secondary Schools, by School Type and Program Type.” Accessed June 21, 2022. https://www150.statcan.gc.ca/t1/tbl1/en/tv.action?pid=3710010901.
VanderWeele, T.J. “Activities for Flourishing: An Evidence-Based Guide.” Journal of Positive Psychology & Wellbeing 4, no. 1 (2020): 79–91.