I received a news alert from the Pew Forum on Religion and Public Life where they ran a slide show of religious affiliations and political party, and given that they ran one of the few Asian American surveys ever, I thought surely they would add in the Asian Americans this time. Alas no. So I found the numbers from both the July report and from the recent slideshow to put together a few figures that help us put race and religion in a more comprehensive picture of where a lot of religiously-identified voters stand:
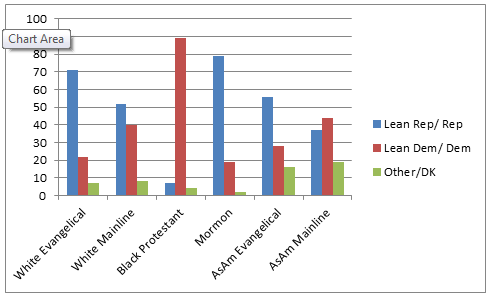
Figure 1: Protestantism and Race
Pardon the color switching, it’s just the default on Excel and I didn’t have time to figure out how to change it. The main takeaway I see here is that white Protestant affiliates and Asian American evangelicals lean Republican more so than lean Democrat. Black Protestants and Asian American Mainline Protestants lean Democrat more than Republican. I couldn’t find recent data for the Latino Protestant party preference which would have really been comprehensive. Unlike white and black Protestants, Asian American Protestants seem to be divided on political party preference.
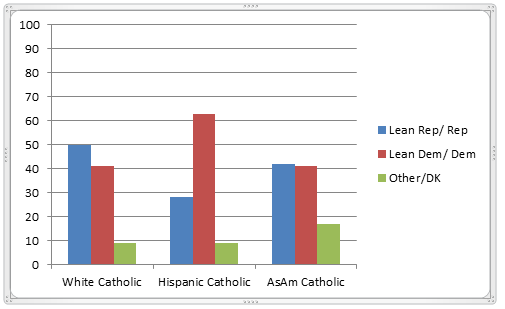
Figure 2: Catholicism and Race
Here we have data on the Hispanic Catholic case which we can then compare Asian American and white Catholics. In similar fashion to the Protestant analysis, I couldn’t find current data on black Catholic party preference. The main observations here are that Catholics are somewhat more moderate (admittedly based on only 3 groups). Hispanic Catholics follow Black Protestants and Asian American Mainliners as more pro-Democrat Christian, while white Catholics tilt slightly in favor of Republican identification. The Asian American Catholic case is very interesting as it is the only instance in which there is some parity in party preference. This would be a religious swing vote group for sure. But to be clear, Asian American Catholics form 19% of the 6% of the US population that identifies as Asian American.
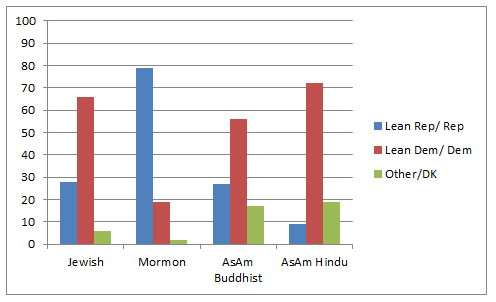
Figure 3: Minority Religions and Race
Mormons are reintroduced here for comparison since they constitute less than 3% of the population. Again we have no current data on American Muslim and Sikh voter preference. That said, we see that 3 of these 4 minority religious groups lean Democrat whereas Mormons lean Republican. American Jews and Mormons usually identify racially as white so these two groups reflect interesting contrasts in the political orientations of two predominantly white minority religious groups. Among the two predominantly Asian minority religious groups the patterns of political preference are somewhat parallel.
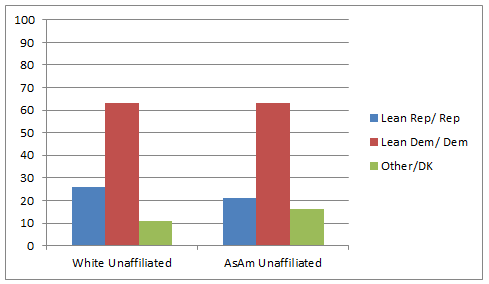
Figure 4: Unaffiliated by Race
We lack data on African American and Latino unaffiliated political party preference so we can examine the largest racial group of the nonaffiliated along with the minority group with the largest proportional presence of nonaffiliated Americans. We see here a very similar pattern in party preference, with a clear Democrat leaning by white non-Hispanic nonaffiliates and Asian American nonaffiliates.
Overall these figures suggest that the religious composition of both parties is quite different from one another. The Republicans might well be considered a very Christian party. Larger proportions of white Protestants (including Mormons), white Catholics and Asian American evangelicals are represented in their ranks. The Democrats would be like a religious salad bowl consisting of larger proportions of many religious constituencies including African American Protestants, Hispanic Catholics, Asian American Mainline, Jewish, Buddhist and Hindu Americans. Given that 5 of these 6 religious groups are predominantly racial minority in composition, these religious groups also make Democrats more racially diverse. We also have a sizable presence of religious nones as well and both white and Asian Americans mirror one another. Given the religious diversity of the Democratic party, it makes sense that they will struggle with presenting a religious sensibility that is inclusive of so many perspectives. The Republicans can more easily reference a Christian narrative that is accessible to most in their party.
The other observation I see here is the remarkably higher rates of non-mainstream party preference by Asian Americans regardless of religious group. Asian Americans who said they had some other party preference or could not identify one ranged from 16-19% across religious groups. Non-Asian Americans at most are 11% non-mainstream in their party preference.
It’s important to remember also the general racial composition and religious composition of the US. White non-Hispanics take up 63% of the population, followed by Latinos at 16%, African Americans at 12% and Asian Americans at 6%. Protestantism still dominates at around 60% (or a little lower) followed by Catholicism at 25% and the remaining 15% are a combination of Buddhists, Hindus, Jews, Muslims, Sikhs and other religious groups.
As a sociologist interested in Asian America, the availability of comparable data between Americans of Asian descent and other Americans is a welcome step forward in getting a better idea of the big picture that includes a group that is often sidelined or invisible in public discussion over matters like politics. Hopefully with improved survey tools that can pick up more representations of our major racial groups in the US we’ll have a more clearer picture of the role that religion and race play in the political sphere.
Note: new update here

